
Baby First Year Growth Chart: Complete Guide for Understanding Growth Charts in the First Year


Growth is the primary indicator of a child’s health and development during their formative years. For parents and caregivers, the routine assessment of a baby’s weight, length, and head circumference at medical checkups is a cornerstone of pediatric care. However, the data presented on growth charts can often lead to confusion or unnecessary anxiety. Understanding the methodology, the distinction between various standard charts, and the factors influencing these measurements is essential for an objective evaluation of a child’s progress.
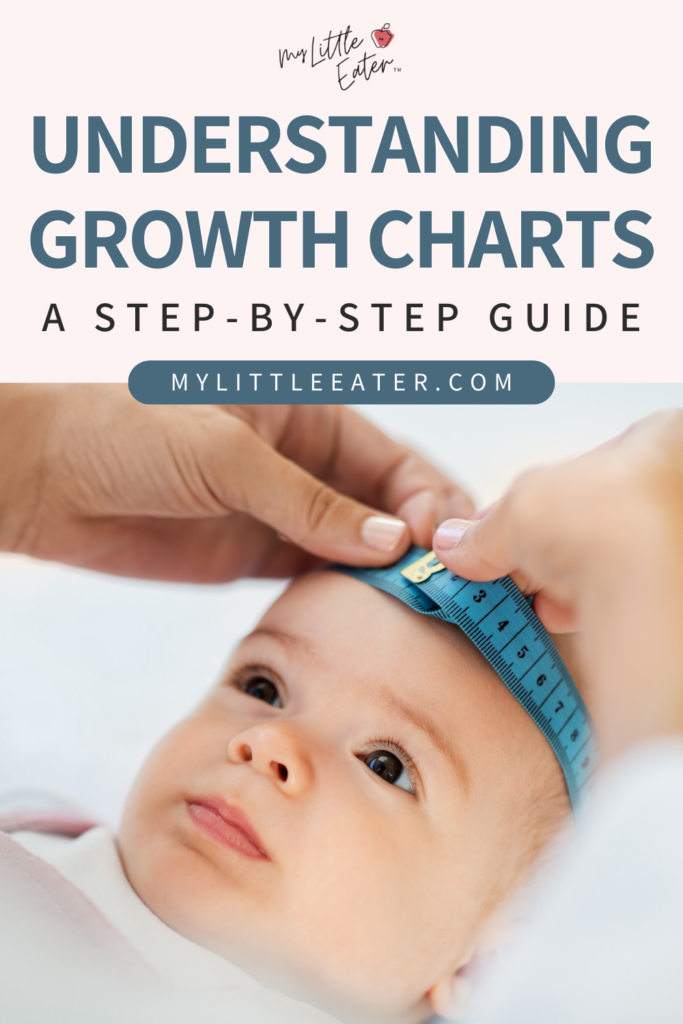
The medical community utilizes standardized growth charts as a longitudinal tool. These charts are not merely snapshots of a child’s physical size at a single point in time; they are trackers that allow healthcare providers to observe growth patterns over months and years. By plotting data points for weight, length, and head circumference against age and sex, doctors can identify potential developmental concerns, nutritional deficiencies, or health anomalies.

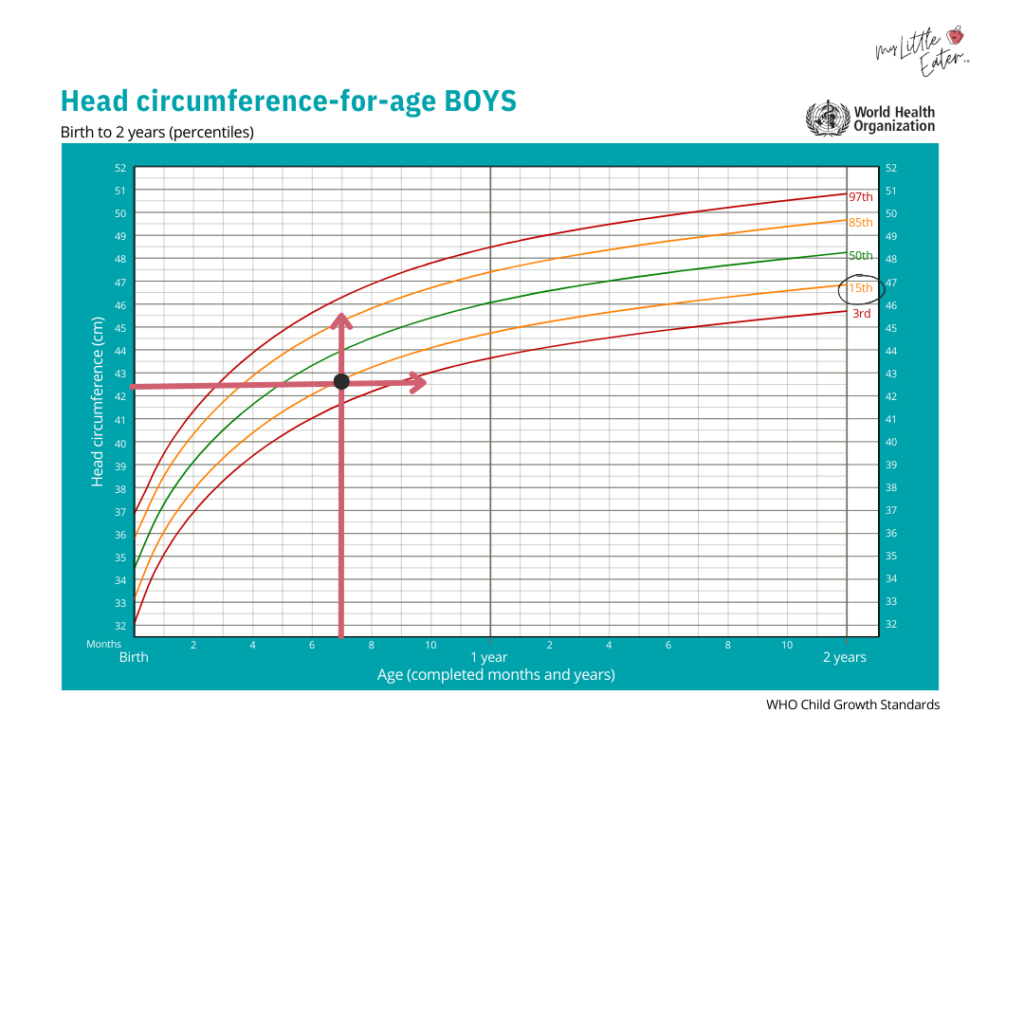
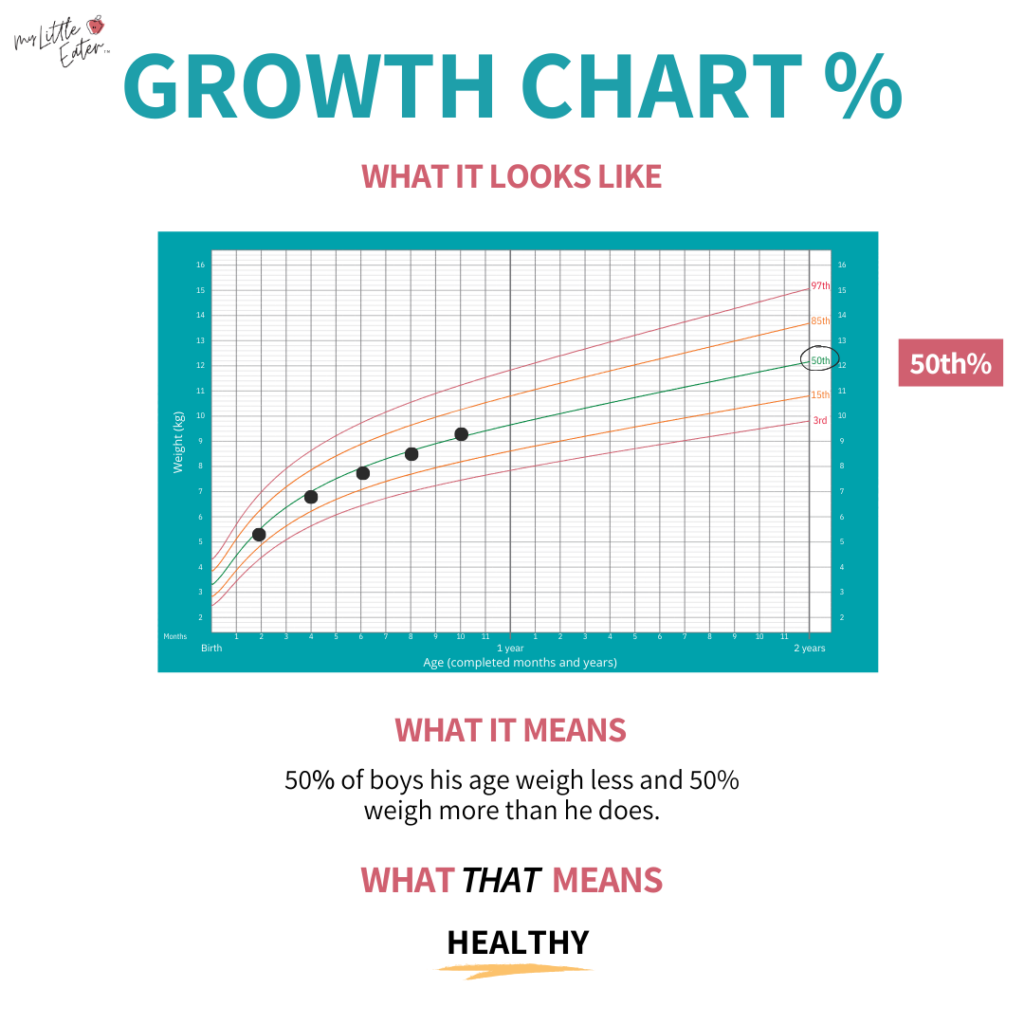
The fundamental components of these charts are percentile lines. If a baby is measured at the 50th percentile, it implies that among a representative sample of 100 children of the same age and sex, 50 are smaller and 50 are larger. A placement at the 10th percentile suggests that 90% of children in the cohort are larger, while 10% are smaller. These percentiles are derived from vast datasets collected from thousands of infants, providing a reference framework for clinicians to assess whether a child is thriving within expected ranges.

The Global Standard for Growth Assessment

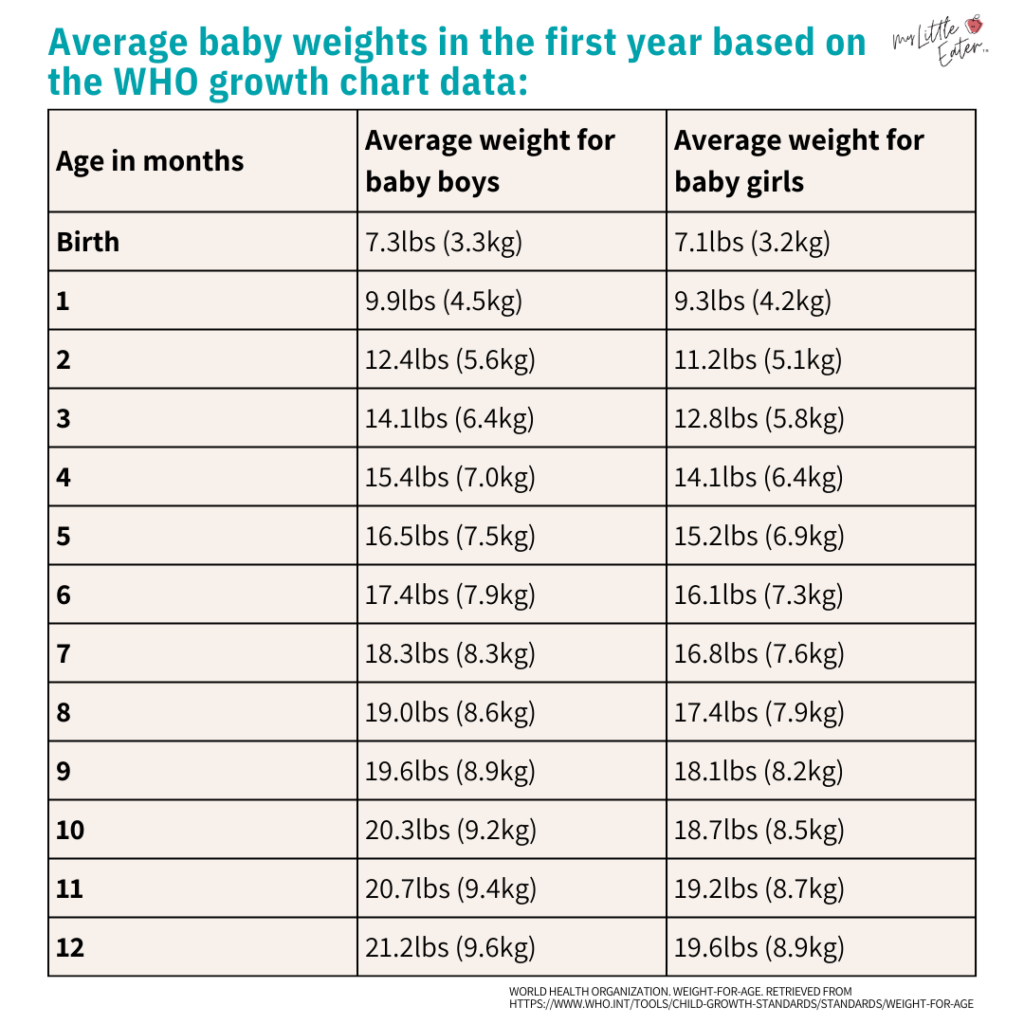
There are two primary sets of growth charts used globally: those developed by the World Health Organization (WHO) and those maintained by the Centers for Disease Control and Prevention (CDC). In Canada and many other nations, the WHO growth standards are the gold standard for children under the age of 19. These standards, based on data collected between 1997 and 2003 from 8,500 infants across six diverse countries—Brazil, Ghana, India, Norway, Oman, and the USA—represent the growth of healthy children raised in optimal conditions, including appropriate nutrition and access to healthcare.
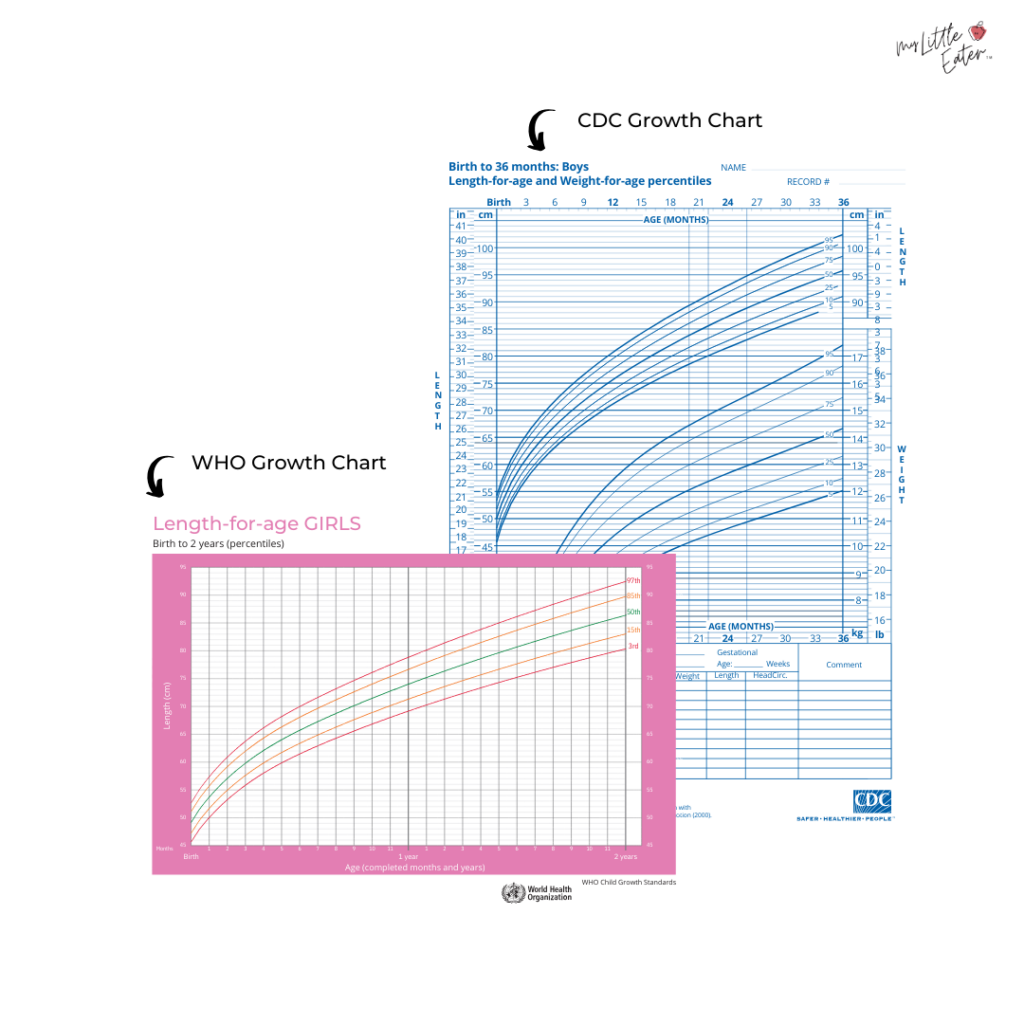
The WHO standards are considered universal, as they describe how children should grow, regardless of whether they are breastfed, formula-fed, or receive a combination of both. In contrast, the CDC growth charts, which are still utilized in the United States for children aged two and older, were derived from national surveys conducted between 1963 and 1980. These charts reflect how children grew in a specific environment during that era, rather than providing an ideal standard of healthy growth. Consequently, pediatric organizations generally prioritize the WHO standards for infants under two years of age because they provide a more accurate representation of healthy, physiological development.

Interpreting Percentiles and the Importance of Trends
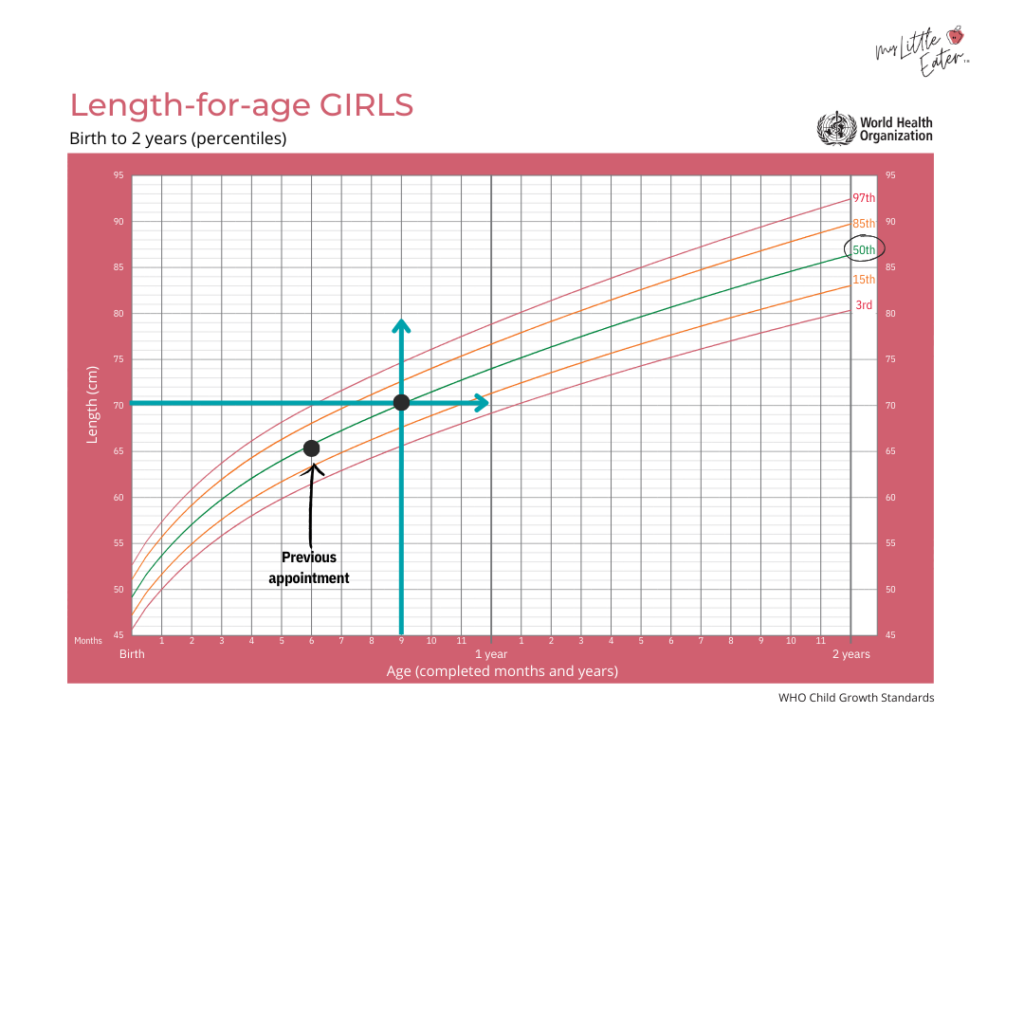
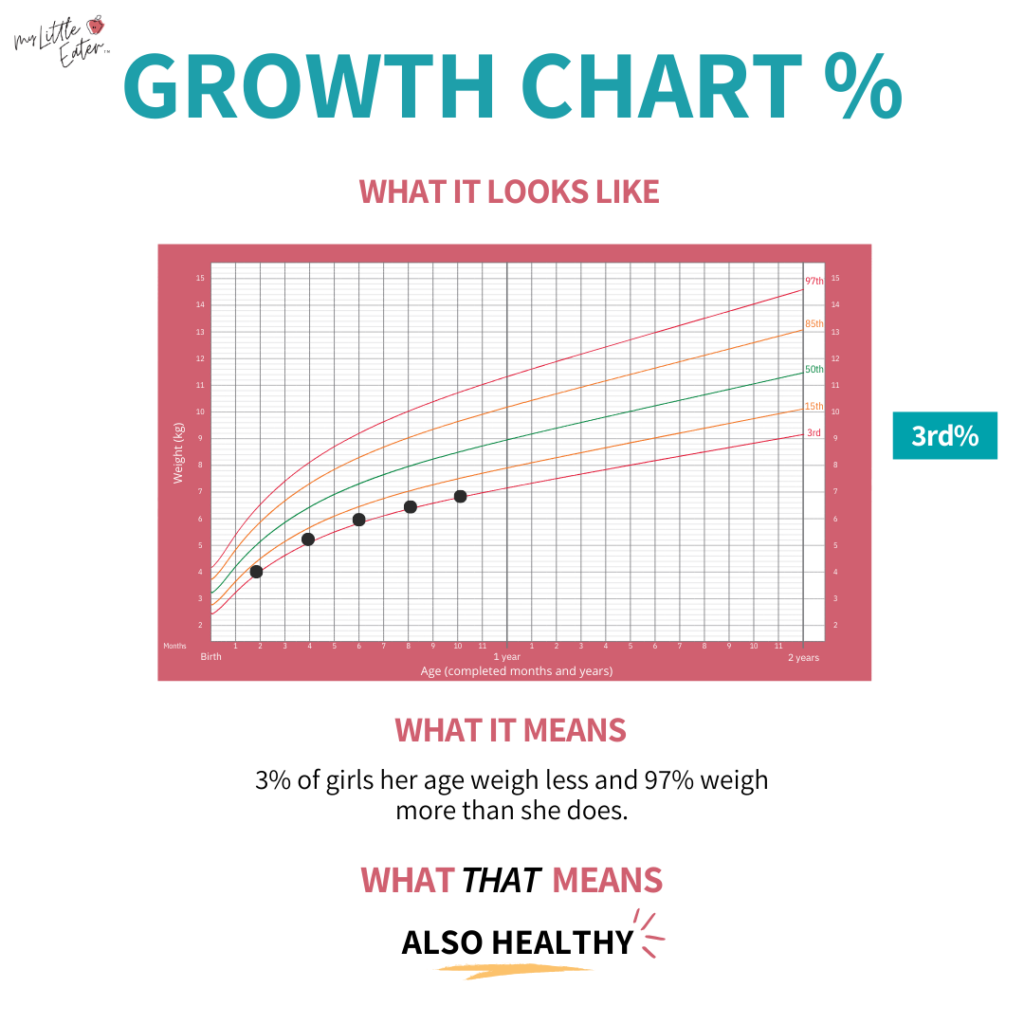
A common misconception among parents is that a "high" percentile is inherently better than a "low" one. In reality, a child’s position on the chart is less important than the consistency of their growth trajectory. A healthy infant may naturally fall on the 5th, 50th, or 95th percentile. Pediatricians look for a steady curve that mirrors the percentile lines on the chart.
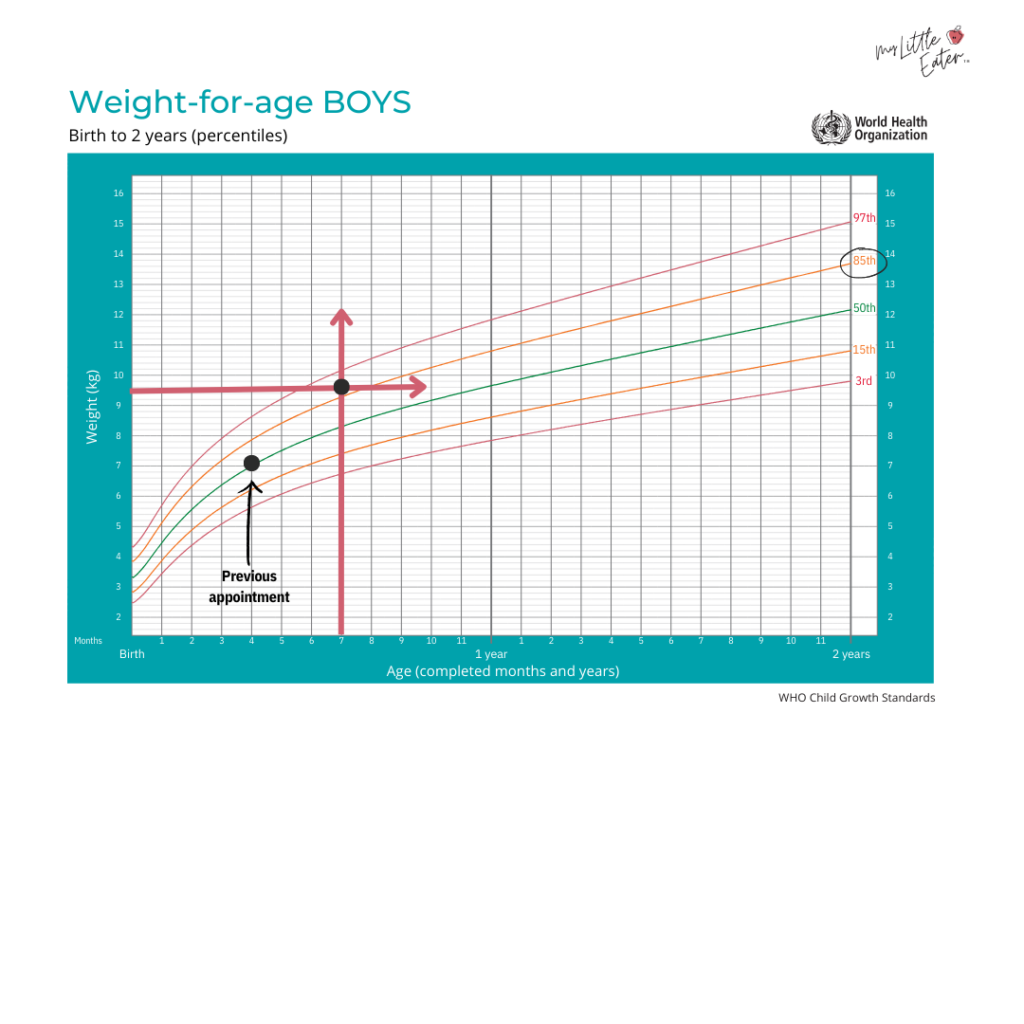
A sudden deviation from this established trend—often described as "falling off the growth curve"—is the primary indicator that warrants a clinical investigation. If an infant who has consistently tracked at the 75th percentile suddenly drops to the 25th, or if a child’s growth remains flat while their age advances, medical professionals will initiate an assessment to rule out underlying issues such as malabsorption, metabolic disorders, or chronic illness. The "two-percentile rule," which once suggested that a drop across two major percentile lines was a red flag, is less relevant when using the WHO charts, which feature larger, uneven gaps between lines. Instead, clinical judgment is used to evaluate any significant shift in growth velocity.
Factors Influencing Infant Growth Patterns

Multiple variables contribute to an infant’s growth velocity. Genetics play a significant role; children whose parents are taller are statistically more likely to follow a higher height-for-age curve. Similarly, sex assigned at birth remains a biological factor, with males generally trending toward larger measurements than females.

Feeding methods also create distinct growth patterns. In the first six months of life, breastfed infants often gain weight more rapidly than their formula-fed counterparts, but this trend frequently shifts after the six-month mark. Formula-fed infants may exhibit a higher rate of weight gain after three months, illustrating that "average" is a fluid concept influenced by diet. Furthermore, environmental factors during pregnancy—such as maternal health, nutrition, and exposure to substances—can have lasting impacts on an infant’s birth size and subsequent growth trajectory.
Clinical intervention is generally reserved for children who fall consistently below the 3rd or above the 97th percentile, or for those whose growth curve shows sharp, unexplained shifts. Nutrition is frequently the first area scrutinized. Pediatric dietitians emphasize that infants require sufficient caloric intake and specific nutrients, such as iron, for healthy brain and bone development. A diet heavy in dairy-based products without adequate iron supplementation, for instance, can sometimes be linked to stunted height in older infants.
Growth Spurts and Physiological Milestones

Parents should be aware that infancy is characterized by periodic growth spurts, which can lead to temporary increases in appetite and minor, normal fluctuations in weight-for-age percentiles. These spurts typically occur at intervals such as 2-3 weeks, 6 weeks, 3 months, and 6 months. During these phases, it is common for a baby to demand more frequent feedings or larger volumes of milk.

If a baby crosses one or two percentiles during a period of rapid development, it is often a benign event. Healthcare providers differentiate between these natural spurts and actual growth disturbances by assessing the infant’s overall clinical presentation, including developmental milestones and feeding history. If a pediatrician identifies a legitimate growth concern, they may refer the family to a registered dietitian or a feeding specialist. This collaborative approach ensures that the child receives personalized nutrition guidance rather than being subjected to unnecessary dietary restrictions or pressure-feeding, which can inadvertently foster long-term behavioral issues with food.

Addressing Misconceptions about Prematurity and Solids
Infants born prematurely require a specialized approach to growth monitoring. For these children, clinicians use preterm growth charts, such as the Fenton chart, while the infant is in the neonatal intensive care unit. Once discharged, the infant can transition to the WHO growth charts, provided that their "corrected age"—the age adjusted for the number of weeks they were born early—is used for plotting data.
Additionally, the timing of introducing solid foods is often a point of confusion. Some parents hope that early introduction of solids will accelerate weight gain in smaller infants. However, clinical evidence suggests that introducing solids before a baby is developmentally ready (typically around six months) may displace essential breastmilk or formula intake, potentially reducing total nutrient and caloric consumption. The consensus among pediatric experts is to wait for clear signs of developmental readiness, such as the ability to hold the head up and show interest in food, rather than using weight as the sole trigger for starting solids.

Broader Implications for Pediatric Health

The use of international growth standards like the WHO charts has helped standardize pediatric care on a global scale. By providing a baseline that transcends ethnicity and geography, these charts allow for a more equitable assessment of child health. As the prevalence of pediatric obesity and nutritional imbalance continues to be a public health focus, the ongoing refinement of these charts ensures that they remain relevant to modern demographics.

For parents, the takeaway remains consistent: the growth chart is a tool for communication between the parent and the physician. It is not a scorecard for the baby. While the numbers provide critical data, they must always be interpreted within the context of the child’s unique health, environment, and development. When parents understand the science behind these charts, they can better engage with their healthcare providers, reduce unnecessary stress, and focus on providing the nurturing environment essential for their child’s long-term success. Through consistent monitoring and professional guidance, the vast majority of infants will follow a healthy, individual path of development.