
A Comprehensive Guide to Understanding Baby Growth Charts and Percentiles in the First Year


Growth is a fundamental indicator of a baby’s health and development, making growth charts and percentiles a significant concern for parents. These tools, while intended to be reassuring, can often lead to anxiety due to the constant monitoring, especially during the crucial first year. Understanding what these numbers truly mean is essential to avoid unnecessary worry or complacency about potential health issues. This guide delves into the research behind growth charts, how to interpret them, and what they signify for a child’s evolving health.

What are Baby Growth Charts and Percentiles?
Growth charts are standardized graphs utilized by healthcare professionals to track a child’s growth trajectory over time. They meticulously monitor key measurements such as weight, height, and head circumference, comparing them against data from other children of the same age and sex. The primary purpose of these charts is to ensure that a child is growing at an expected rate and to identify any potential growth or health problems early on.
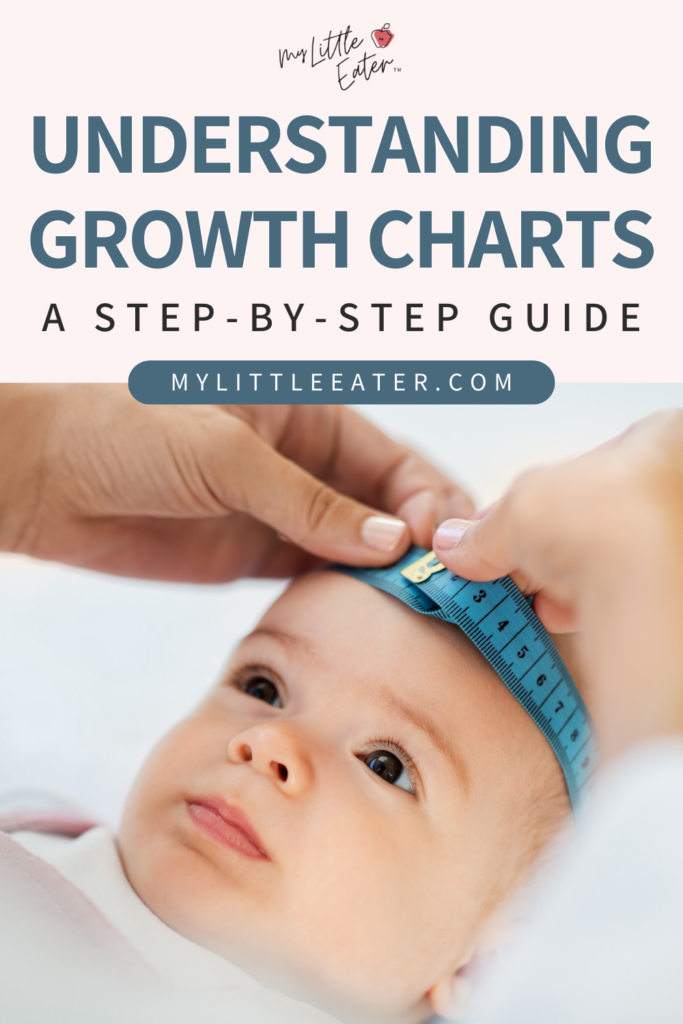
These charts are distinguished by percentile lines, typically including marks like the 3rd, 50th, and 85th percentiles. A child’s position on these lines indicates their percentile rank. For instance, a child at the 50th percentile means that 50% of children their age are larger, and 50% are smaller. If a child is at the 10th percentile, it signifies that 90% of their peers are larger, and only 10% are smaller.
The data used to create these growth charts is derived from extensive studies involving thousands of infants and toddlers whose growth patterns were tracked over extended periods. This collective data allows for the establishment of average growth benchmarks against which new children’s development can be measured.

World Health Organization vs. Center for Disease Control Growth Charts
Two primary organizations provide the growth charts most commonly used worldwide: the World Health Organization (WHO) and the Centers for Disease Control and Prevention (CDC).

In Canada, all children under 19 years of age utilize the WHO growth charts. These charts are based on data collected between 1997 and 2003 from approximately 8,500 infants and young children globally. The WHO growth charts are designed to depict the growth of healthy children under optimal conditions, often including those who were exclusively breastfed for at least four to twelve months. They serve as a standard for healthy growth and are recommended for all infants, irrespective of their feeding method, whether breastfed, formula-fed, or a combination.
In the United States, the CDC recommends the WHO growth charts for children under two years old. For children aged two and above, the CDC growth charts are utilized. These CDC charts were developed using data from national surveys of U.S. children collected between 1963 and 1980. They reflect how children grew within a specific environmental context rather than representing ideal growth.

Recommendation: Prioritizing WHO Growth Charts
Generally, the WHO growth charts are recommended over the CDC charts. The WHO charts are based on optimal growth conditions, providing a standard for how children should grow, which is considered more indicative of healthy development than simply reflecting past growth patterns within a specific environment.
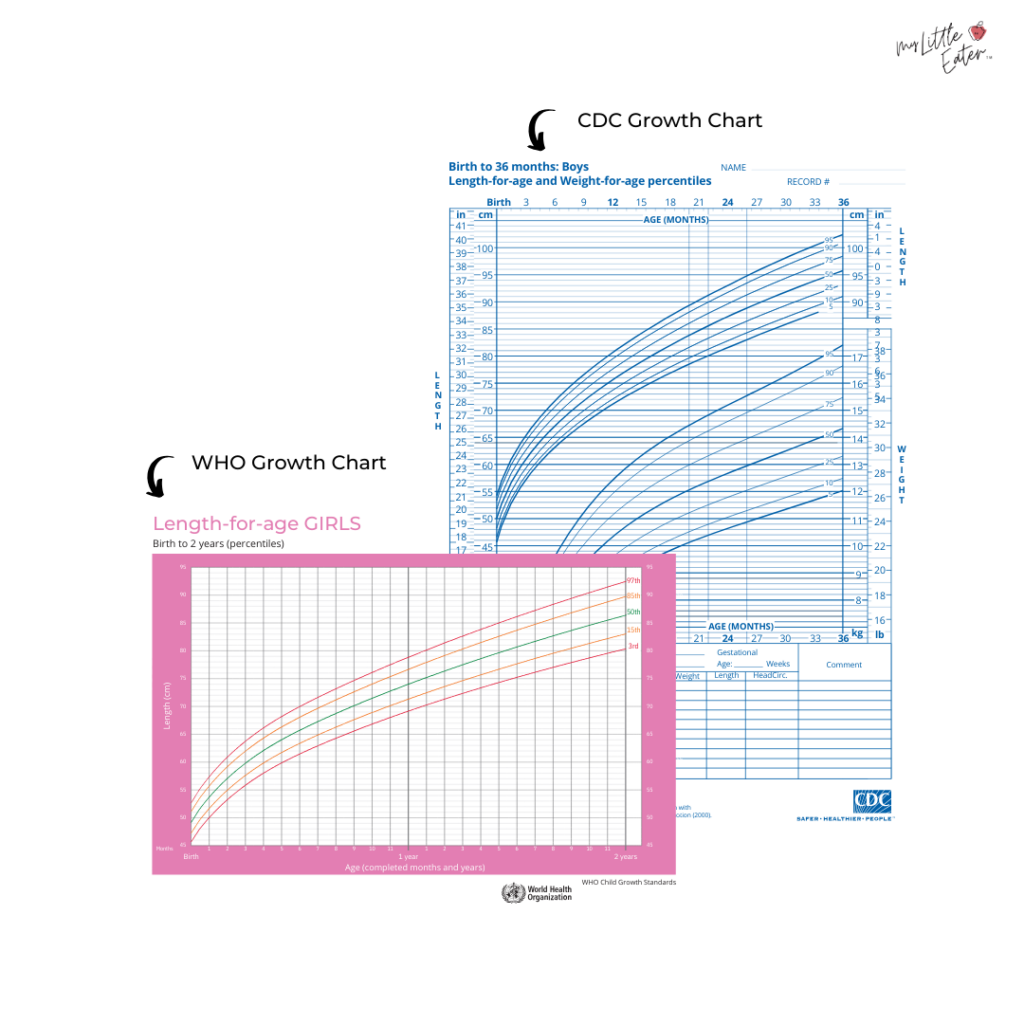
If a healthcare provider is using CDC charts, parents are encouraged to inquire if they can track their baby’s growth using the WHO charts instead. The methodologies for tracking are similar, so physicians should be able to accommodate this request.
If a change in tracking method is not feasible, parents should not panic. If the baby is growing well and developmental milestones are being met, not using the WHO charts exclusively is unlikely to be a significant issue. However, if concerns about growth do arise, parents can utilize their child’s measurements from doctor appointments to track their growth on the WHO charts at home.

Interpreting Percentile Curves on Growth Charts
While growth charts may appear complex, they are relatively straightforward to interpret once the key components are understood. The appropriate chart should be selected based on the baby’s age and sex assigned at birth.
Commonly used charts include:
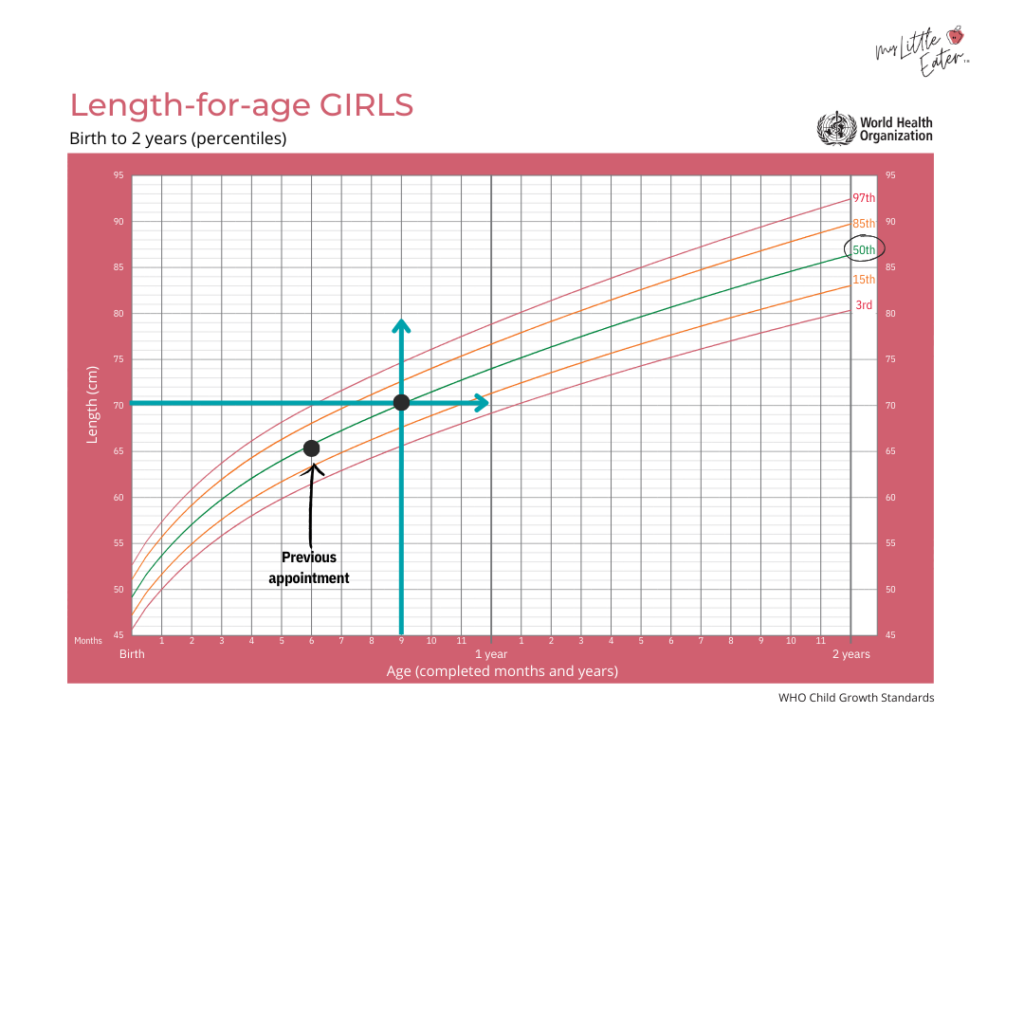
- Length-for-age: This chart compares a child’s length to the average length for their age. The horizontal axis typically represents age in months, and the vertical axis represents length in centimeters.
- Weight-for-age: This chart compares a child’s weight to the average weight for their age and sex. The horizontal axis is usually age in months, and the vertical axis is weight in kilograms.
- Weight-for-length: This chart assesses a child’s weight relative to their length. It’s often used for more in-depth assessments and may not be as frequently utilized as the other charts.
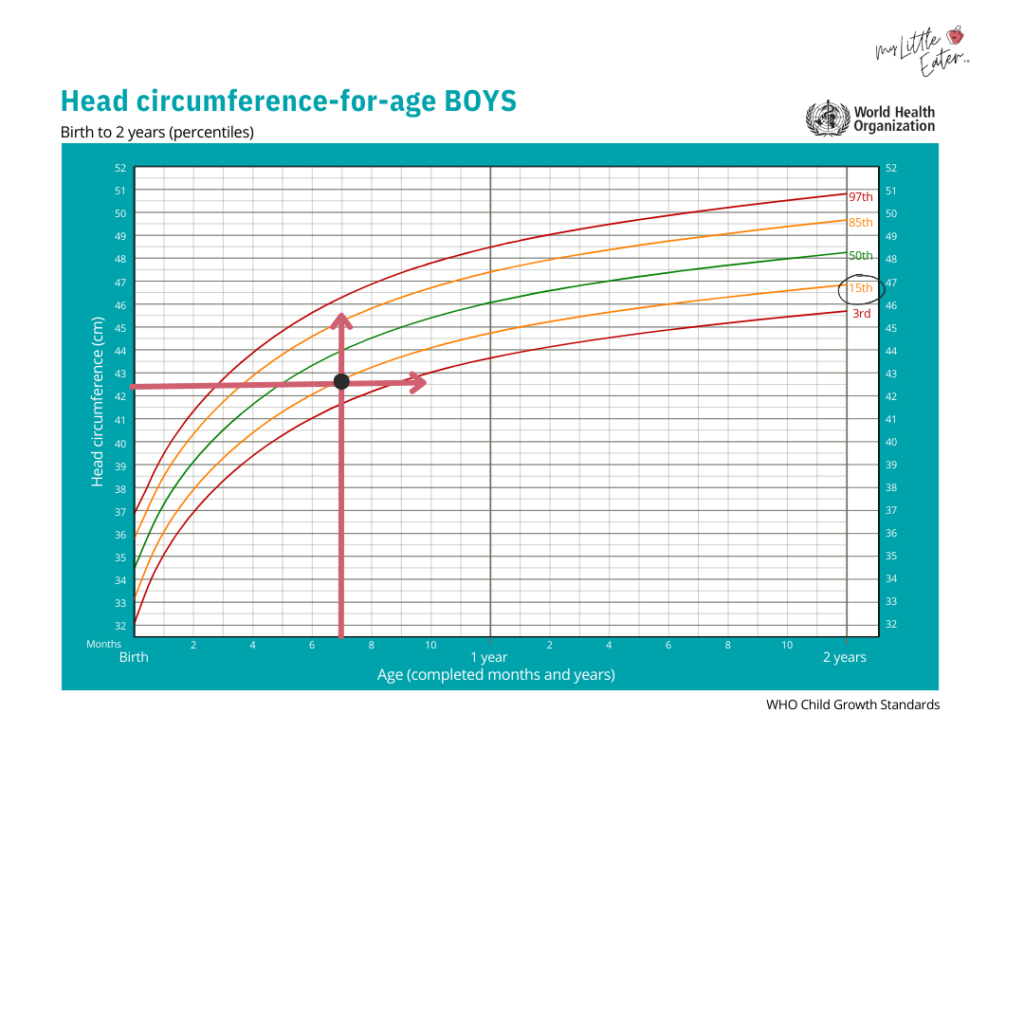
- Head circumference-for-age: This chart tracks a child’s head circumference in relation to their age. The horizontal axis typically denotes age in months, and the vertical axis represents head circumference in centimeters.
Step-by-Step Guide to Reading Percentiles:
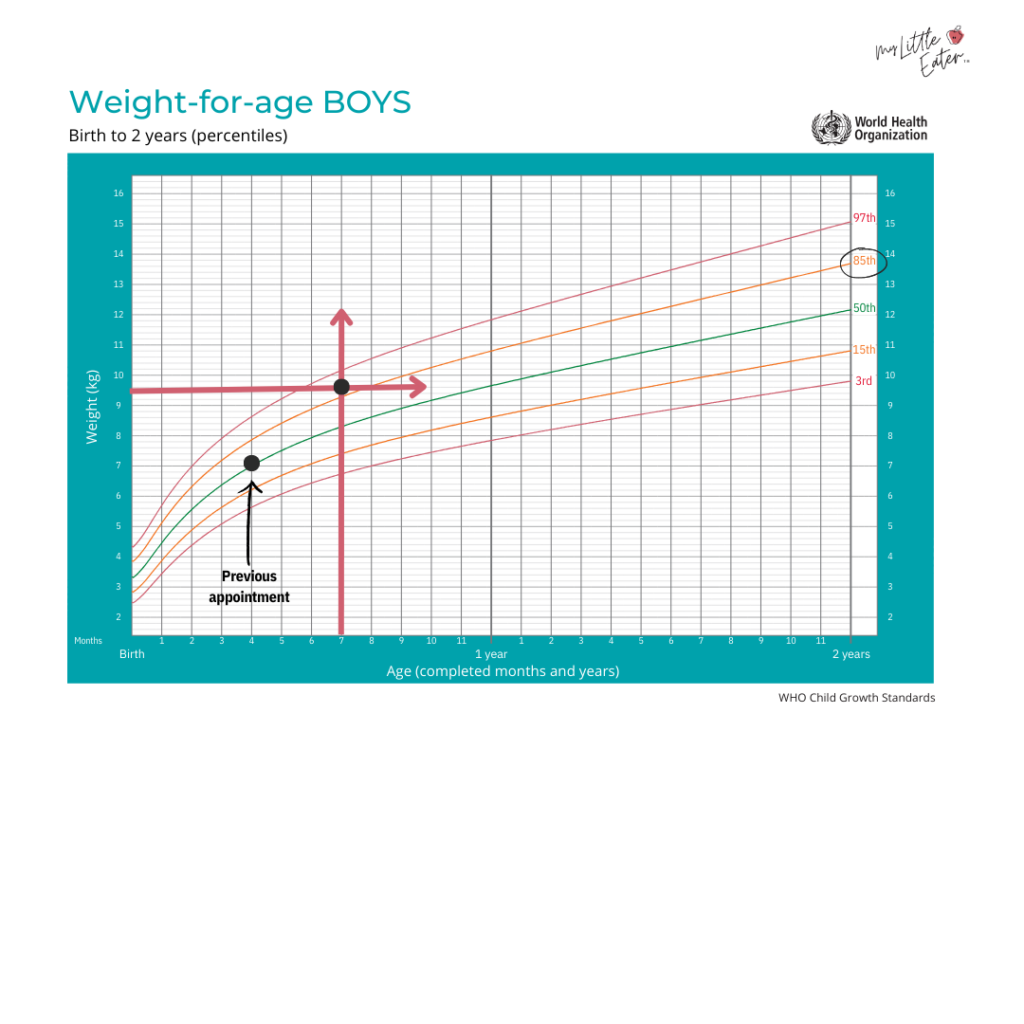
- Identify the Correct Chart: Select the growth chart appropriate for your child’s age and sex.
- Locate Age: Find your child’s age on the horizontal axis (usually months or years).
- Locate Measurement: Find your child’s measurement (length, weight, or head circumference) on the vertical axis.
- Find the Intersection Point: Trace lines from the age and measurement points until they intersect.
- Identify the Percentile: Determine which percentile curve this intersection point falls closest to. This indicates your child’s percentile rank.
For example, a 9-month-old baby girl who is 70 cm long might fall closest to the 50th percentile on the length-for-age chart. This means that 50% of 9-month-old girls are longer, and 50% are shorter.
What Constitutes a "Good" Percentile for Baby Growth?
It is crucial to understand that percentile rankings alone do not definitively determine a child’s health. A single percentile measurement does not indicate if a child is overweight, underweight, or experiencing stunted growth. Instead, it serves as a comparison to their peers.
The true value of growth charts lies in observing the trend of a child’s growth over time. At each well-baby checkup, healthcare providers plot these measurements to track the rate of growth. A consistent growth rate along a specific percentile curve is generally considered healthy, rather than the absolute percentile itself.

When to Be Concerned About Growth Curves and Percentiles
Two key indicators are considered when evaluating a baby’s growth:

-
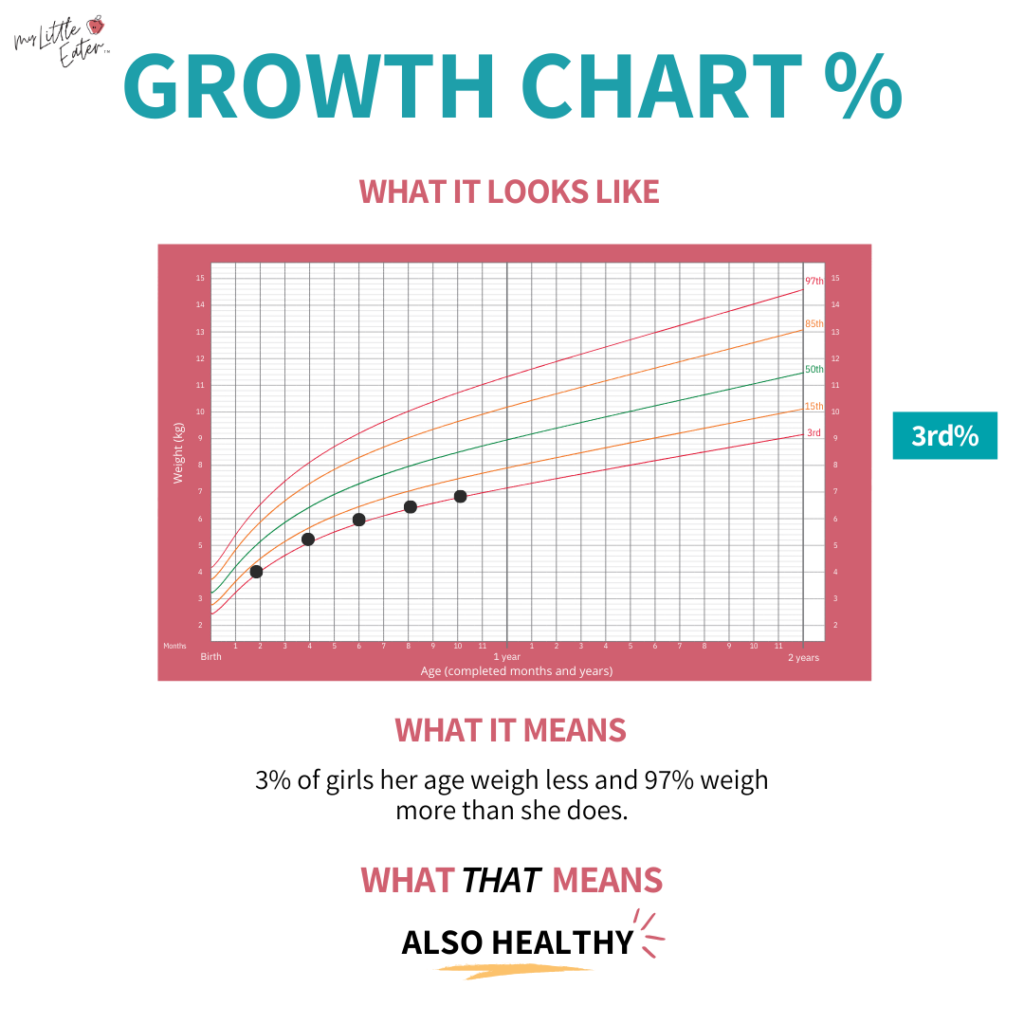
Percentile Range: Generally, children falling between the 3rd and 97th percentiles are considered within a healthy range. Falling below the 3rd or above the 97th percentile may warrant further assessment to screen for risks like malnutrition. However, it’s important to remember that many healthy children exist outside the 50th percentile.
-
Growth Over Time: The rate of growth is often more significant than a single percentile reading. While parents might worry if their child is at the 90th or 5th percentile, a sudden and significant shift in percentile over time is a more critical indicator. This is often referred to as "falling off the growth curve."
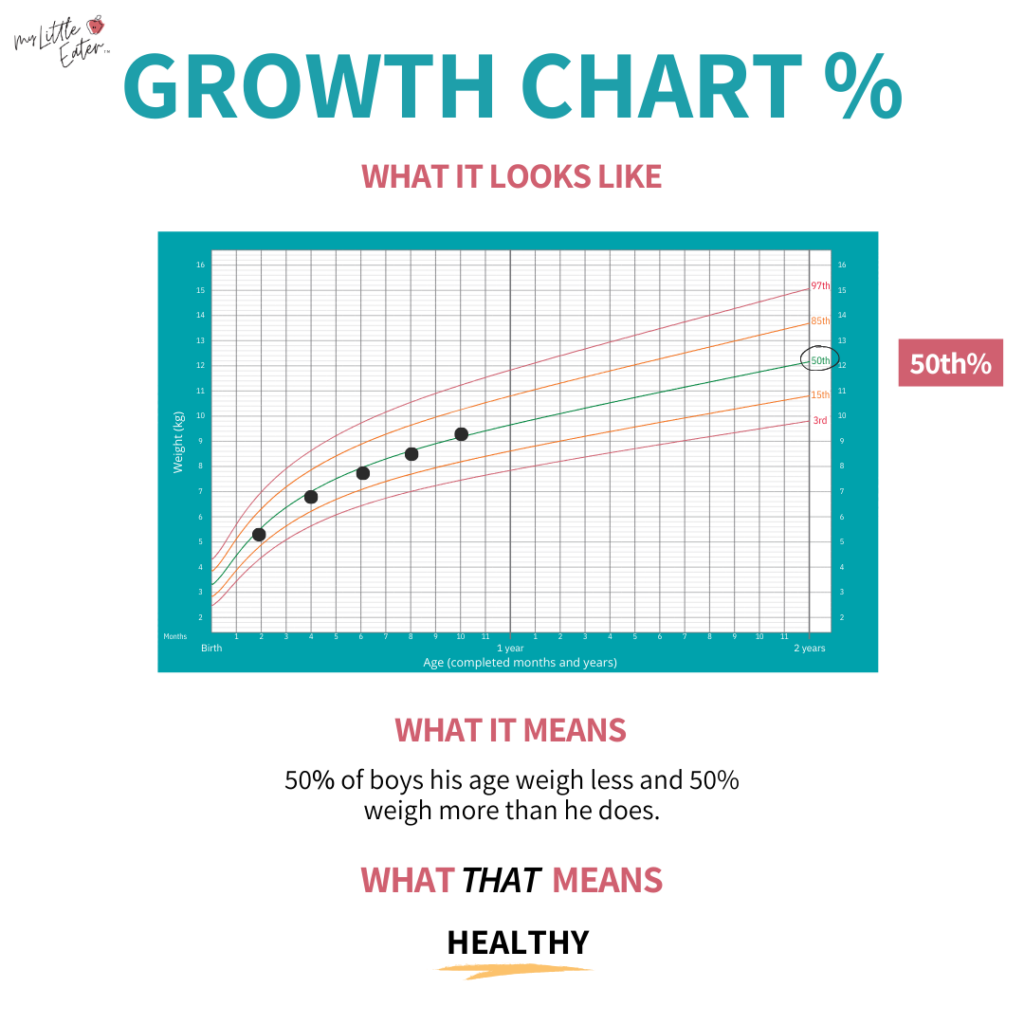
Sudden, steep inclines or declines on the growth chart can signal a potential issue. Conversely, a child consistently tracking along the 5th percentile curve can be just as healthy as a child consistently tracking along the 50th or 95th percentile curve. The focus should be on maintaining a steady growth rate relative to their established pattern.
Factors Affecting Infant Growth
Several factors can influence a baby’s growth trajectory, and these should be considered when interpreting growth charts:
- Feeding Method: Breastfed babies often grow faster in the first six months compared to formula-fed babies. However, after six months, formula-fed infants may experience more rapid weight gain.
- Genetics: Parental height and other genetic traits can influence a child’s growth potential. Taller parents are likely to have taller children.
- Sex as Assigned at Birth: Generally, girls tend to be smaller overall than boys.
- Pregnancy Health: Maternal factors such as smoking, malnutrition, or gestational diabetes during pregnancy can impact a baby’s birth weight and length, potentially affecting their growth trajectory into childhood.
- Nutrition: Insufficient or excessive calorie intake, or the wrong types of calories, are common factors affecting growth. Iron deficiency, for example, can impact height development.
- Health Conditions: Chronic or recurring infections, weakened immunity, inflammatory bowel disease, or celiac disease can lead to decreased nutrient absorption and slower growth.
- Growth Spurts: Babies experience periods of rapid physical growth in both weight and height. These spurts are normal and can lead to temporary shifts in percentile rankings.
Baby Growth Spurts and Percentile Changes

During the first year, it is normal for babies to jump one or two percentiles for weight and length due to growth spurts. These spurts typically occur around 2-3 weeks, 6 weeks, 3 months, and 6 months. A baby experiencing a growth spurt may have an increased appetite, requiring more frequent feedings, and soon after, may outgrow their clothing sizes.
These percentile changes due to growth spurts are usually temporary and do not indicate a problem. Healthcare providers consider the overall growth pattern, feeding patterns, and developmental milestones when assessing any variations.

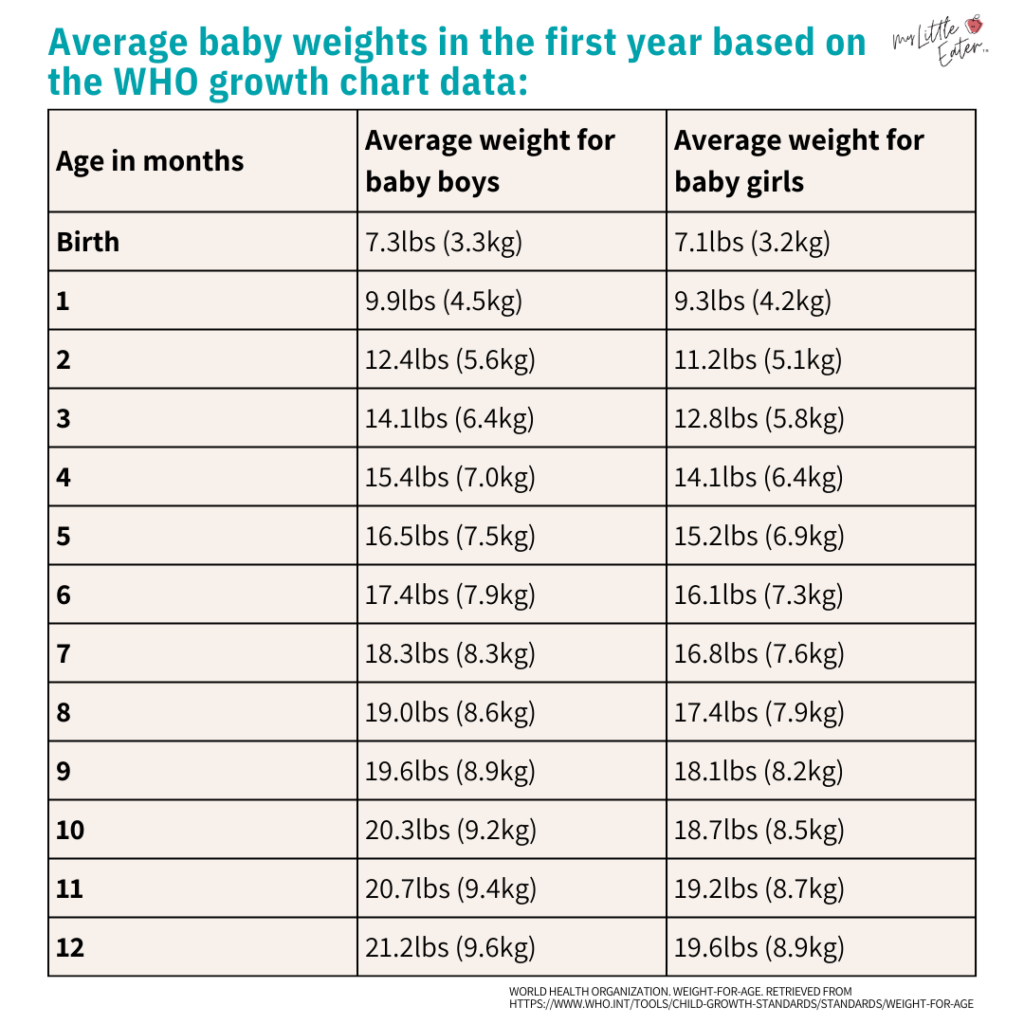
Average Baby Weight by Month
While percentiles are crucial, parents often seek information on average baby weights. The following table provides average weights for baby boys and girls by month, reflecting the 50th percentile on growth charts. It’s essential to reiterate that these are averages, and significant variations are normal and healthy.

| Age (Months) | Average Baby Girl Weight (kg) | Average Baby Boy Weight (kg) |
|---|---|---|
| 0 | 3.3 | 3.5 |
| 1 | 4.2 | 4.5 |
| 2 | 5.1 | 5.4 |
| 3 | 5.9 | 6.2 |
| 4 | 6.5 | 6.8 |
| 5 | 7.0 | 7.3 |
| 6 | 7.4 | 7.7 |
| 7 | 7.8 | 8.1 |
| 8 | 8.1 | 8.4 |
| 9 | 8.4 | 8.7 |
| 10 | 8.6 | 8.9 |
| 11 | 8.8 | 9.1 |
| 12 | 9.0 | 9.3 |
(Note: These are approximate values adapted from CDC data and should be used for reference only, not as a definitive measure of health.)
Next Steps When Concerned About a Baby’s Percentile
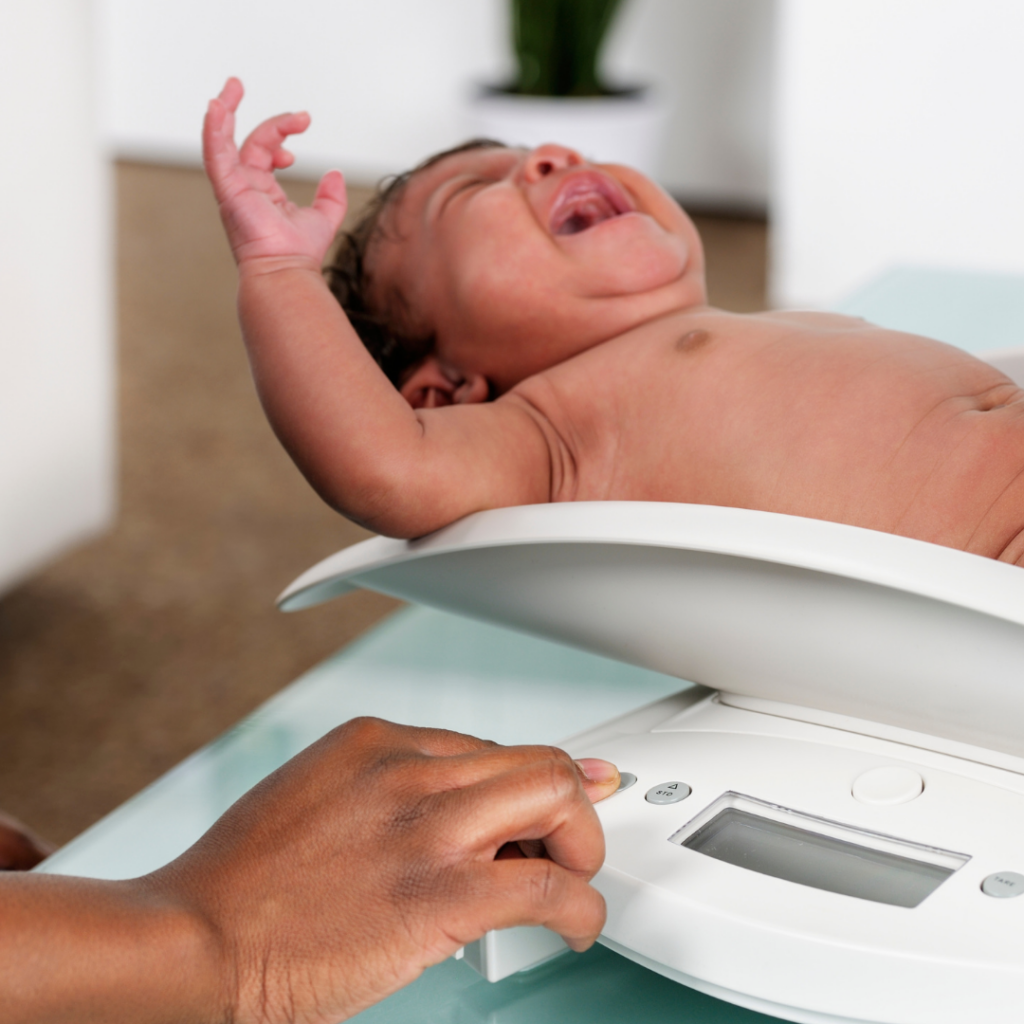
If a healthcare provider expresses concerns about a baby’s growth, they may monitor the child’s weight more closely and investigate potential medical, developmental, or feeding issues. Referrals to specialists, such as registered dietitians, may be recommended. These specialists can provide personalized guidance on nutrition, feeding strategies, and help address any underlying concerns to ensure the baby is growing optimally.
Growth Charts for Different Racial and Ethnic Groups
The WHO growth charts are based on data collected from children in six countries—Brazil, Ghana, India, Norway, Oman, and the USA—suggesting a global representation. Research indicates minimal differences in growth patterns across various racial and ethnic groups when children are raised in optimal conditions, such as access to healthcare, proper nutrition, and smoke-free environments. This supports the use of WHO growth charts as an international standard for healthy growth across diverse populations.
In contrast, the CDC growth charts, developed from data collected between 1963 and 1980, may not fully reflect the current demographic diversity of the United States.

Toddler Growth Charts
Growth chart recommendations vary by age. In Canada, WHO Child Growth Standards are used for children from birth to 5 years, with WHO Reference 2007 Growth Charts for ages 5 to 19. In the U.S., the CDC charts are used for children aged 2 and older. While the charts differ, their interpretation methods remain consistent. For toddlers past two to three years of age, sudden shifts in growth percentiles may warrant further investigation by a pediatrician.

Addressing Specific Concerns: Premature Babies, Solids, and BMI
- Premature Babies: Specialized preterm growth charts, such as Fenton’s chart, are used for infants born before 37 weeks gestation. Once discharged, these babies can transition to WHO growth charts, using their "corrected age" for plotting measurements.
- Starting Solids and Weight Gain: Introducing solids before six months, the recommended age, does not necessarily help babies gain weight and can potentially displace nutrient-rich breast milk or formula, leading to lower overall calorie intake.
- BMI-for-Age: For children under two years, weight-for-length charts are preferred. BMI-for-age charts are recommended for children aged two and older to monitor growth and identify malnutrition.
- Z-Scores: Z-scores provide a more precise measure than percentiles, indicating how many standard deviations a child’s measurement is from the average. A Z-score of 0 is average, positive scores are above average, and negative scores are below average.
Conclusion

Understanding baby growth charts is a vital aspect of ensuring a child’s healthy development. While percentiles offer a snapshot of a child’s growth in comparison to their peers, the long-term growth trajectory is the most critical indicator. By working closely with healthcare providers, utilizing appropriate growth charts, and considering various influencing factors, parents can gain confidence in their child’s health and well-being. When concerns arise, seeking professional guidance from pediatricians and registered dietitians is paramount to developing a personalized plan for optimal growth.
Related posts: