

Growth is a fundamental indicator of a baby’s health and development, making growth charts and percentiles a significant topic for parents. While these tools are designed to provide reassurance, the frequent check-ins, especially during the first year, can sometimes lead to increased anxiety. Understanding what these numbers truly mean is crucial to avoid unnecessary worry or complacency regarding a child’s well-being. This guide aims to demystify the research behind growth charts, explain how to read them, and interpret the information for your growing child.

What Are Baby Growth Charts and Percentiles?
Baby growth charts are visual tools used by healthcare professionals to track a child’s growth pattern over time. These charts meticulously monitor key measurements such as weight, height, and head circumference. A child’s progress is then compared against a standardized dataset of other children of the same age and sex. The primary purpose of these charts is to ensure that a child is growing at an expected rate and to identify any potential growth or health issues early on.
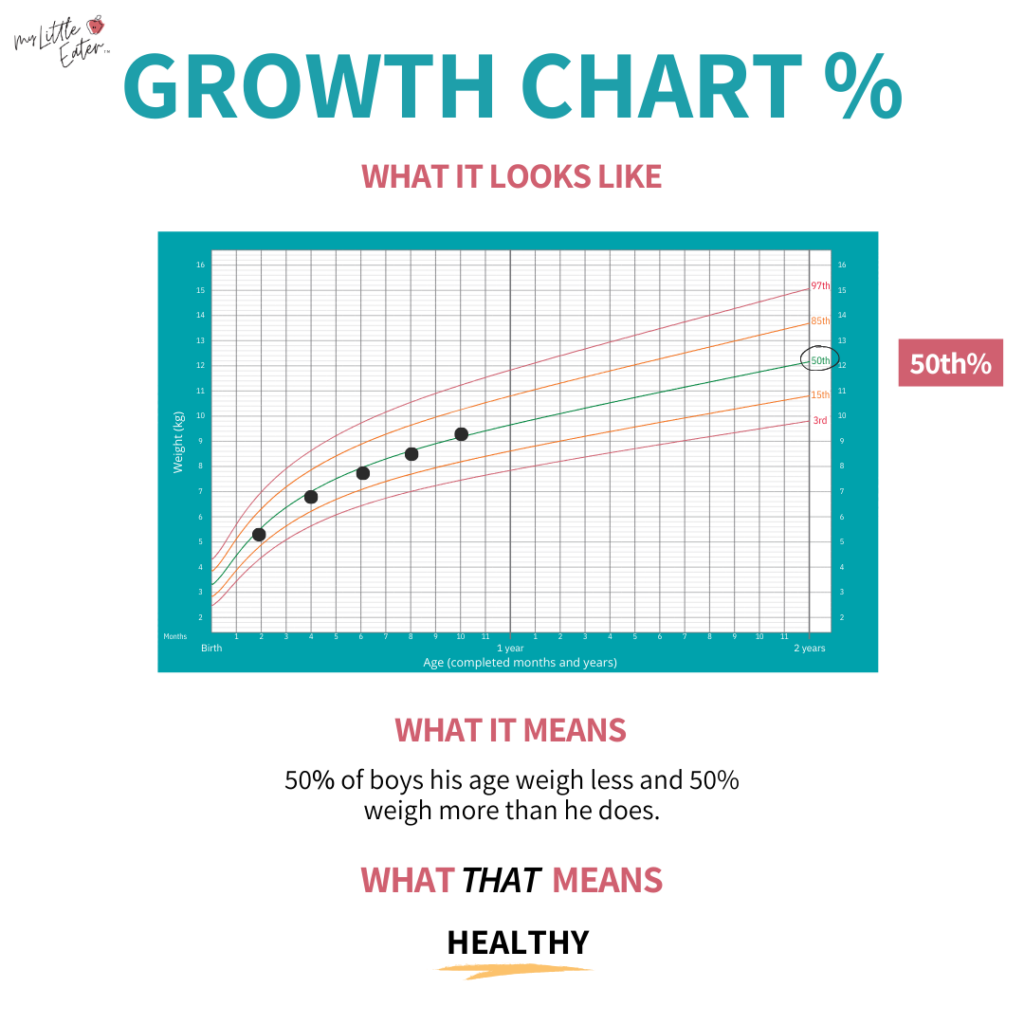
Each growth chart is marked with percentile lines, typically including the 3rd, 50th, and 85th percentiles, among others. These lines indicate where a child’s measurements fall in relation to their peers. For instance, if a child is at the 50th percentile for height, it means that 50 out of 100 children of the same age and sex are taller, and 50 out of 100 are shorter. Conversely, a child at the 10th percentile means 90 out of 100 children are taller, and 10 out of 100 are shorter.
The data used to create these charts is derived from extensive studies where thousands of babies and toddlers have been measured and weighed over time. This collective data allows for the establishment of average growth patterns, which serve as a reference point for monitoring new generations of children.
World Health Organization vs. Center for Disease Control Growth Charts
Two primary sets of growth charts are widely used: those developed by the World Health Organization (WHO) and those from the Centers for Disease Control and Prevention (CDC).

In Canada, all children under 19 years of age utilize the WHO growth charts. The current WHO charts are based on data collected between 1997 and 2003 from approximately 8,500 infants and young children globally. These charts are designed to represent the growth of healthy children under optimal conditions, with a particular emphasis on those who were exclusively breastfed for at least four to 12 months. The WHO charts are considered standards for healthy growth and are recommended for all babies, irrespective of their feeding method—whether breastfed, formula-fed, or combination-fed.
In the United States, the CDC recommends the WHO growth charts for children under two years old. For children aged two and older, the CDC growth charts are utilized. The CDC charts were developed from national surveys conducted in the U.S. between 1963 and 1980, reflecting how children grew within that specific environmental context. Unlike the WHO charts, which depict ideal growth, the CDC charts illustrate observed growth patterns in a particular population.

Generally, healthcare professionals recommend the WHO growth charts over the CDC charts. The WHO charts provide a benchmark for how children should grow under optimal conditions, offering a more aspirational standard for healthy development.
If a child’s doctor uses the CDC growth charts and parents prefer the WHO charts, it is advisable to discuss this with the physician. Since the tracking methods are similar, most doctors can accommodate this request. If a change in tracking method is not possible, and concerns arise about a child’s growth, parents can utilize the measurements obtained during doctor’s appointments to track their child’s growth on WHO charts at home.

Interpreting Percentile Curves on Growth Charts
Growth charts may appear complex initially, but understanding their components makes interpretation straightforward. It’s essential to select the correct growth chart based on the child’s age and sex assigned at birth.
Commonly used charts include:
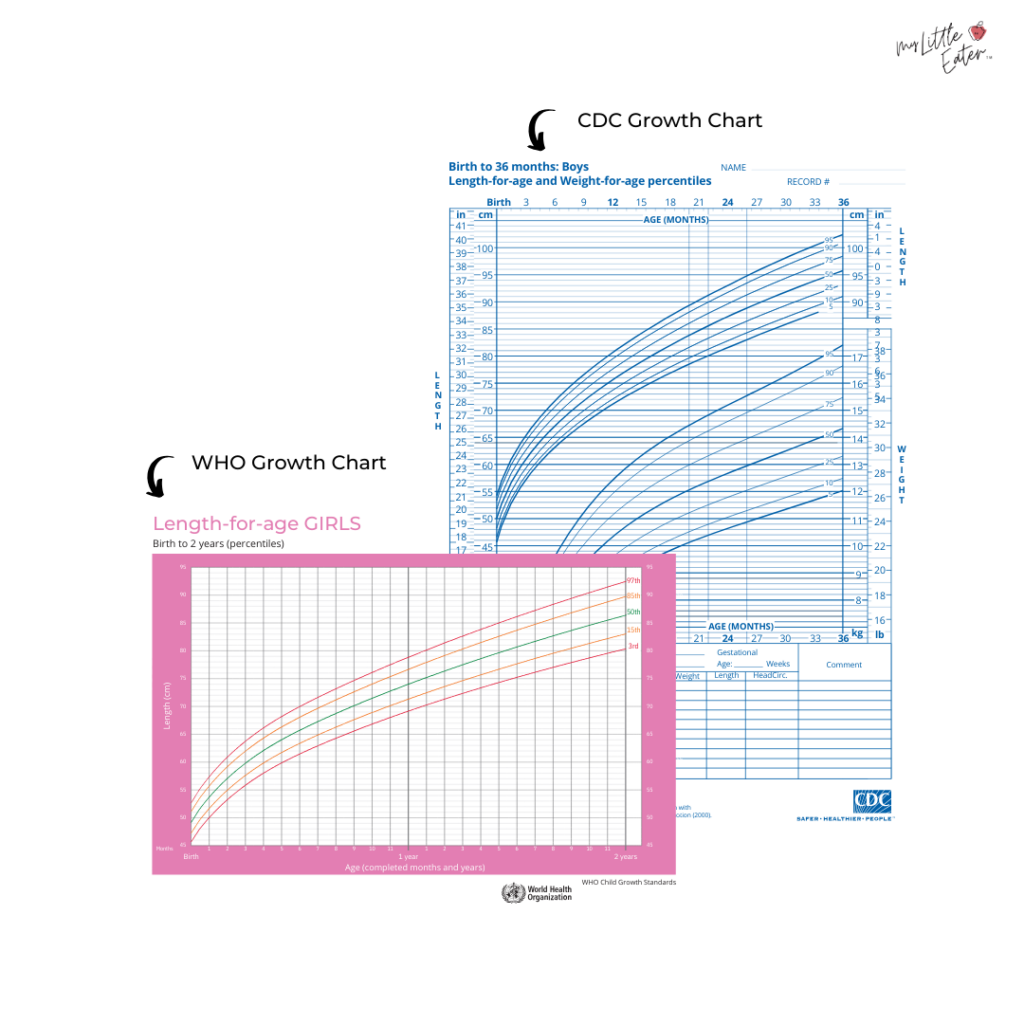
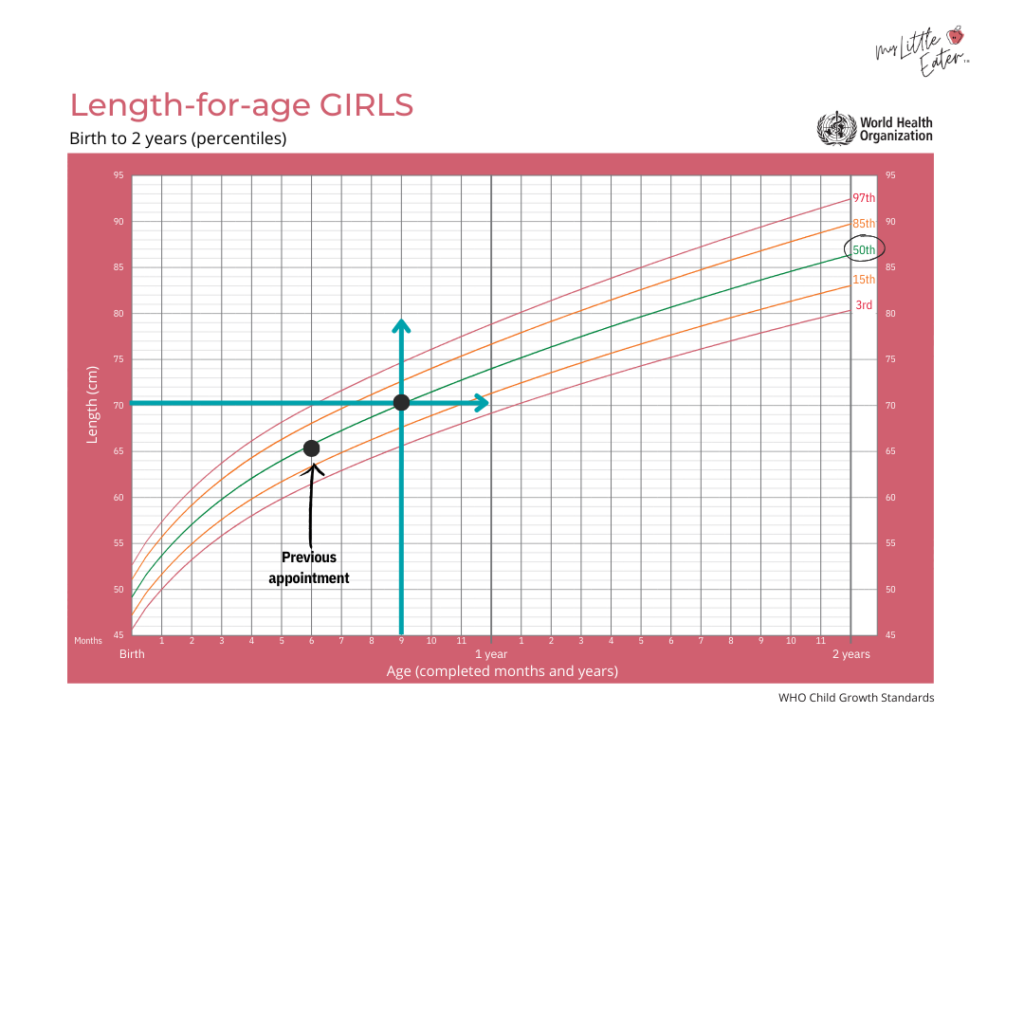
- Length-for-age: This chart compares a child’s length to the average length for their age. The age in months is typically found on the bottom horizontal axis, and length in centimeters on the left vertical axis.
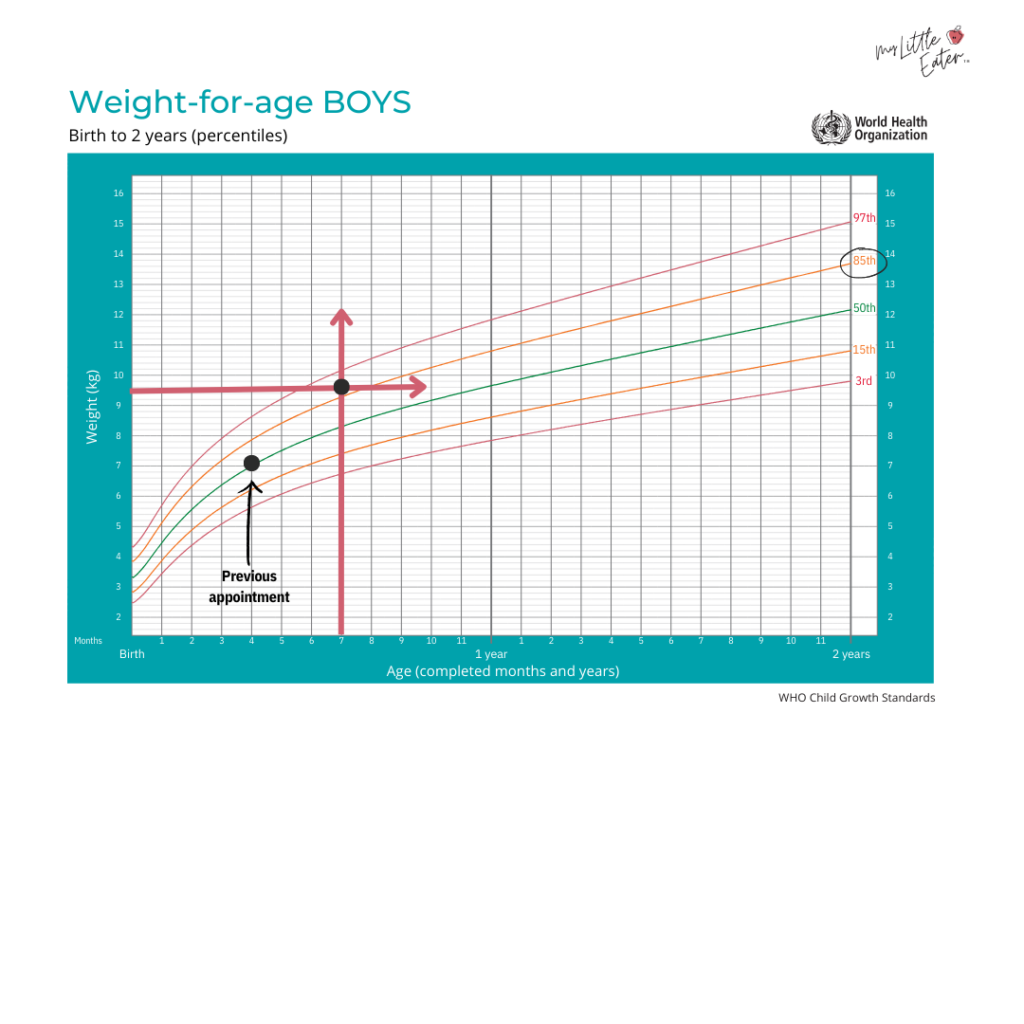
- Weight-for-age: This chart compares a child’s weight to the average weight for their age. Age in months is on the horizontal axis, and weight in kilograms on the vertical axis.
- Weight-for-length: This chart assesses a child’s weight relative to their length. It is often used for more in-depth assessments rather than routine monitoring.
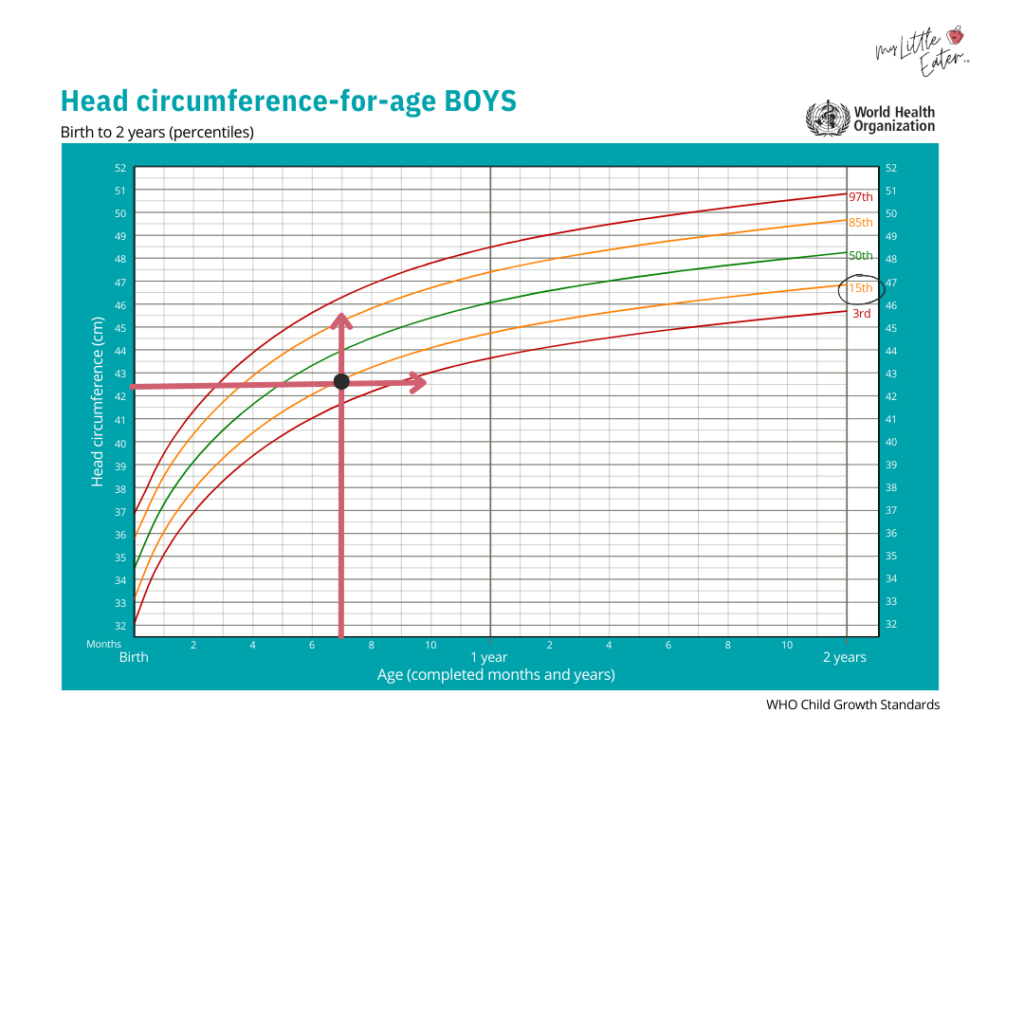
- Head circumference-for-age: This chart tracks the circumference of a child’s head against the average for their age. Age is on the horizontal axis, and head circumference in centimeters on the vertical axis.
Step-by-Step Guide to Reading Percentiles:
- Identify the Correct Chart: Select the appropriate growth chart based on your child’s age and sex.
- Locate Age: Find your child’s age on the horizontal axis (usually months).
- Locate Measurement: Find your child’s measurement (length, weight, or head circumference) on the vertical axis.
- Plot the Point: Mark the point where the age and measurement intersect on the chart.
- Follow the Curve: Observe which percentile line this point falls closest to. This indicates your child’s percentile for that specific measurement.
For example, if a 9-month-old girl is 70 cm long, finding 9 months on the horizontal axis and 70 cm on the vertical axis, the intersection point might fall closest to the 50th percentile line on a length-for-age chart. This signifies that she is at the 50th percentile for length, meaning half of the baby girls her age are longer, and half are shorter. Consistency in percentile tracking over time is generally more important than the specific percentile number itself.

What Constitutes a "Good" Percentile for Baby Growth?
A common question among parents is what percentile is considered "good" for their baby. It’s crucial to understand that growth percentiles, in isolation, do not definitively determine a child’s health. A single percentile measurement cannot classify a child as underweight, overweight, or stunted. Instead, percentiles serve as a comparative tool, relating a child’s growth to that of their peers.
Growth charts provide insight into a child’s growth trend over time. During regular well-baby checkups, healthcare providers plot a child’s height and weight on their growth chart. The physician’s primary focus is on monitoring the trend of these measurements over successive appointments, rather than fixating on a single data point. This consistent tracking of the growth curve is a more reliable indicator of healthy development than a child’s position on a single percentile line at one moment in time.
When to Be Concerned About Growth Curves or Percentiles
There are two primary indicators that warrant attention when evaluating a baby’s growth trajectory:
-
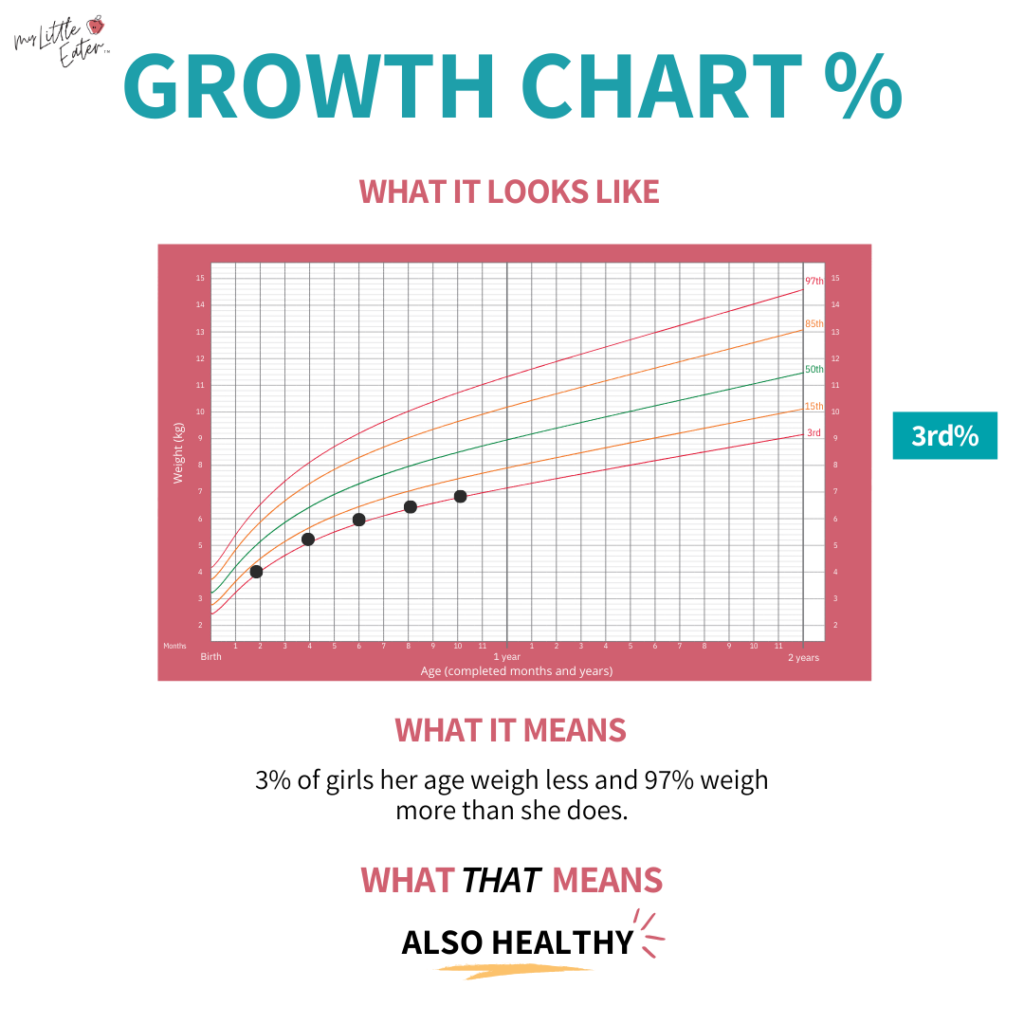
Percentile Range: Generally, children are considered to be within a healthy range if they fall between the 3rd and 97th percentiles. These boundaries serve as a screening tool for potential malnutrition risk. If a child falls consistently below the 3rd or above the 97th percentile, it may suggest the need for further medical assessment and intervention. However, it’s important to remember that many healthy children naturally fall outside the middle percentiles.
-
Growth Over Time: The rate of growth is often more significant than the absolute percentile. Parents may become anxious if their child is on the 90th percentile or the 5th percentile, but this isn’t necessarily a cause for concern. Healthy children can maintain positions at either end of the growth spectrum. The real concern arises when there is a significant and sudden change in a child’s growth pattern. This is often referred to as "falling off the growth curve."
A sudden drop or rise of two or more percentiles, especially after a period of steady growth, can indicate a potential issue. This can manifest as a sharp decline on the growth chart or growth that remains consistently flat without increasing. This principle highlights that a child consistently at the 5th percentile who has always been there may be perfectly healthy, whereas a child who was previously at the 90th percentile and has now dropped to the 50th percentile warrants investigation.
Factors Affecting Infant Growth
Numerous factors can influence a child’s growth pattern, and each child’s trajectory is unique. When assessing growth charts, healthcare providers consider several elements:
- Feeding Method: Breastfed babies often grow faster in the first six months compared to formula-fed babies. However, intake can influence weight gain, and breastfed babies may gain weight more slowly after the initial period. Formula-fed infants may experience faster growth after three months and tend to gain weight more rapidly after six months.
- Genetics: Parental genetics play a significant role. Taller parents are more likely to have taller children, and genetic predispositions can influence overall growth patterns.
- Sex Assigned at Birth: Generally, girls tend to be smaller overall than boys.
- Pregnancy Health: Maternal factors such as smoking, malnutrition during pregnancy, and gestational diabetes can impact a baby’s birth weight and length, potentially influencing their growth trajectory into childhood.
- Nutrition: Insufficient calorie intake, excessive calorie intake, or the wrong types of calories are common factors affecting growth. A lack of calories often affects weight first, followed by height. Inadequate iron intake, particularly in children with diets high in dairy, can also lead to stunted height.
- Health Conditions: Chronic or recurring infections, compromised immunity, inflammatory bowel disease, or celiac disease can lead to reduced calorie intake and slower weight gain.
- Growth Spurts: Babies experience periods of rapid physical growth, which can temporarily affect their position on growth charts.
Baby Growth Spurts and Percentile Changes
Changes in a baby’s growth pattern, particularly percentile jumps, are not always indicative of a problem. During the first year, it is normal for babies to move up or down one or two percentiles due to growth spurts. These spurts typically occur around 2-3 weeks, 6 weeks, 3 months, and 6 months of age.

A growth spurt can be recognized by an increased appetite and a subsequent need for larger clothing sizes. If a percentile change is observed following a growth spurt, it is usually considered normal. Healthcare providers will assess these variations in the context of feeding patterns and developmental milestones. They will look at the complete picture, including feeding habits and overall development, before determining if a concern exists.
If a healthcare provider suspects a growth disturbance, they may refer parents to a feeding specialist or a registered dietitian. These specialists can conduct a thorough assessment, including reviewing the baby’s feeding journal and overall nutritional intake, to develop a personalized plan.
Average Baby Weight by Month
While growth charts are the primary tool for monitoring development, parents often seek information on average baby weights. The following table provides average weights for baby girls and boys by month, based on the 50th percentile data from the WHO growth charts. It is crucial to remember that these are averages, and significant variations are normal and healthy.
(Insert Table of Average Baby Weights by Month for Boys and Girls Here, adapted from WHO data, similar to the provided image. This would ideally be a clear table with columns for Month, Average Weight for Girls (kg/lbs), and Average Weight for Boys (kg/lbs).)
Example Data (Illustrative – actual data to be sourced from reliable WHO/CDC tables):
| Month | Average Weight for Girls (approx.) | Average Weight for Boys (approx.) |
|---|---|---|
| 0 | 3.2 kg / 7.1 lbs | 3.4 kg / 7.5 lbs |
| 1 | 4.1 kg / 9.0 lbs | 4.3 kg / 9.5 lbs |
| 3 | 5.7 kg / 12.6 lbs | 6.0 kg / 13.2 lbs |
| 6 | 7.2 kg / 15.9 lbs | 7.6 kg / 16.8 lbs |
| 12 | 9.4 kg / 20.7 lbs | 9.8 kg / 21.6 lbs |
This table serves as a reference point, but the focus should remain on the child’s individual growth trend rather than adherence to these specific numbers.
Next Steps When Concerned About a Baby’s Percentile
During each checkup, a child’s doctor monitors growth and development, ensuring the growth pattern remains consistent with established percentiles. If concerns arise, the physician may monitor the baby’s weight more closely and investigate potential medical, developmental, or feeding issues. This might involve referrals to specialists, such as registered dietitians, for further guidance.
Areas of focus for specialists may include:

- Feeding method and intake patterns.
- Nutritional content of the diet.
- Sleep quality and duration.
- Activity levels.
- Digestive health and absorption.
- Overall health and any underlying medical conditions.
A food journal can be a valuable tool for parents to track these details, facilitating productive discussions with healthcare providers.
Baby Growth Charts for Different Racial and Ethnic Groups
The development of growth charts has considered their applicability across diverse populations. The WHO growth charts, for instance, were derived from the Multicentre Growth Reference Study, which involved approximately 8,500 children from six countries: Brazil, Ghana, India, Norway, Oman, and the USA. This broad international data collection aimed to establish growth standards that are inclusive of various racial and ethnic backgrounds.

Research from this study indicated minimal differences in growth patterns among children from these diverse cultural backgrounds when raised in optimal conditions, characterized by access to healthcare, proper nutrition, and a healthy environment. Consequently, the WHO asserts that these growth charts can serve as an international standard for all children, regardless of their race or ethnicity. As of 2011, over 125 countries had adopted the WHO growth standards.
In contrast, the CDC growth charts, developed between 1963 and 1980, were based on U.S. population data. At that time, the demographic makeup of the U.S. was predominantly white/Caucasian. As the U.S. population has diversified, the CDC charts may not fully reflect the growth of contemporary, more diverse populations. Therefore, the WHO charts are generally recommended for their broader applicability.

Toddler Growth Charts
Growth charts adapt as children age. In Canada, the WHO Child Growth Standards are used for children from birth to five years, with reference charts for ages five to 19. In the United States, CDC growth charts are employed for children aged two and older, up to 20 years. While the specific charts may differ, their function remains the same: tracking growth against established norms.
While percentile shifts due to growth spurts are common in infants, significant and sudden changes in growth patterns for toddlers over the age of two or three may indicate a growth disturbance and warrant consultation with a pediatrician.
Key Takeaways for Understanding Baby Growth Charts
- Growth is a Trend: The most critical aspect of growth charts is the trend over time, not a single percentile measurement.
- WHO Charts Recommended: The WHO growth charts are generally preferred for their basis in optimal growth conditions and global diversity.
- Percentiles are Comparative: Percentiles indicate how a child measures up against peers of the same age and sex.
- Sudden Changes Warrant Attention: Significant and abrupt shifts in percentile lines can signal a need for further investigation.
- Consider Multiple Factors: Growth is influenced by genetics, nutrition, health, and environmental factors.
- Growth Spurts Are Normal: Temporary percentile jumps are common during infancy due to growth spurts.
- Consult Your Pediatrician: Always discuss any concerns about your child’s growth with their healthcare provider.
Understanding baby growth charts empowers parents to engage more effectively in discussions about their child’s health and development. By focusing on consistent growth trends and consulting with healthcare professionals, parents can ensure their child is thriving on their unique developmental journey.
Related posts: