
Baby First Year Growth Chart: A Comprehensive Guide for Understanding Infant Development Metrics


Monitoring the physical development of an infant is a cornerstone of pediatric care. From birth, healthcare providers utilize standardized growth charts to track weight, length, and head circumference, providing parents and clinicians with objective data to assess a child’s health trajectory. While these charts are essential tools for identifying potential developmental issues early, they are frequently misunderstood, leading to unnecessary parental anxiety or, conversely, a lack of awareness regarding genuine health concerns. To navigate these metrics effectively, it is necessary to understand the methodology behind the data, the distinction between various chart types, and the factors that influence a child’s individual growth pattern.

The Mechanics and Purpose of Growth Percentiles
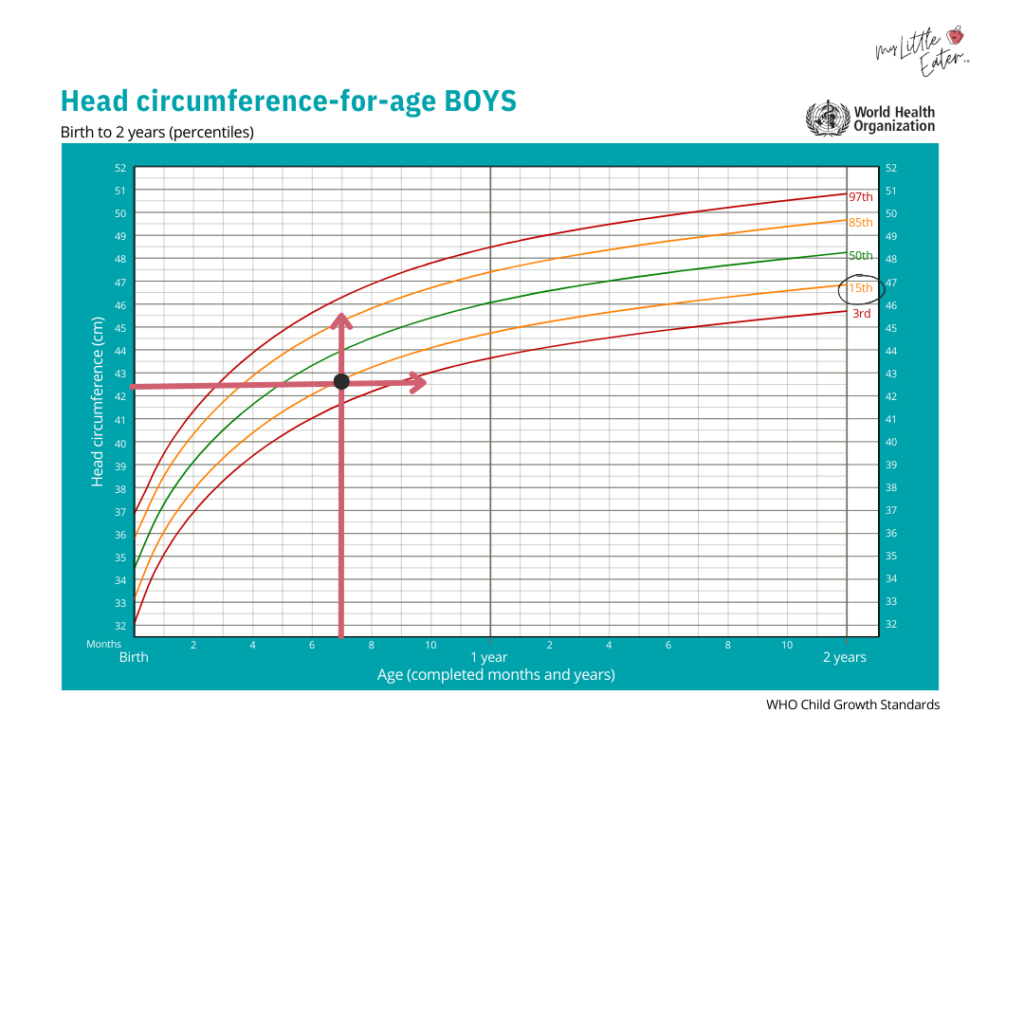
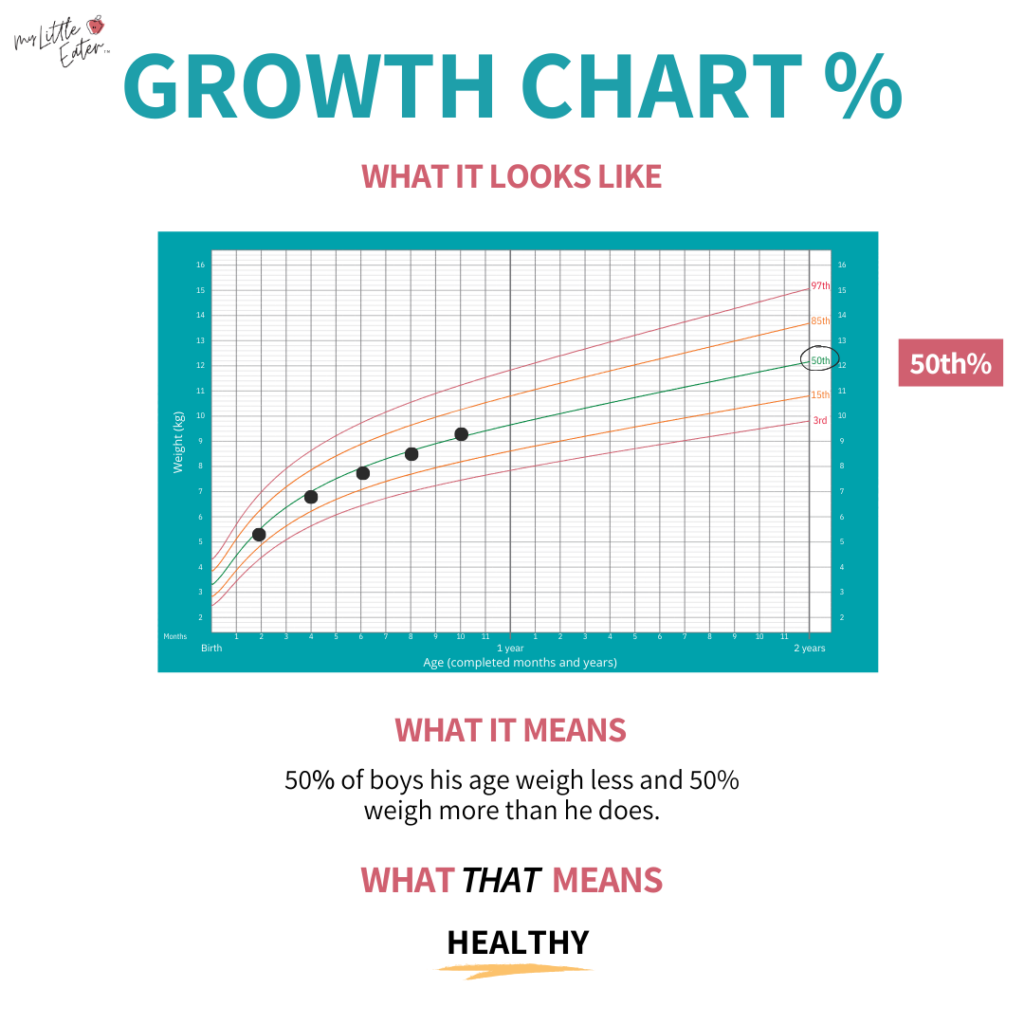
Growth charts are not merely record-keeping tools; they are diagnostic instruments. By plotting a child’s measurements against a representative population of peers of the same age and sex, doctors can identify consistent growth patterns. Central to these charts are percentile lines—typically 3rd, 50th, 85th, and 97th.

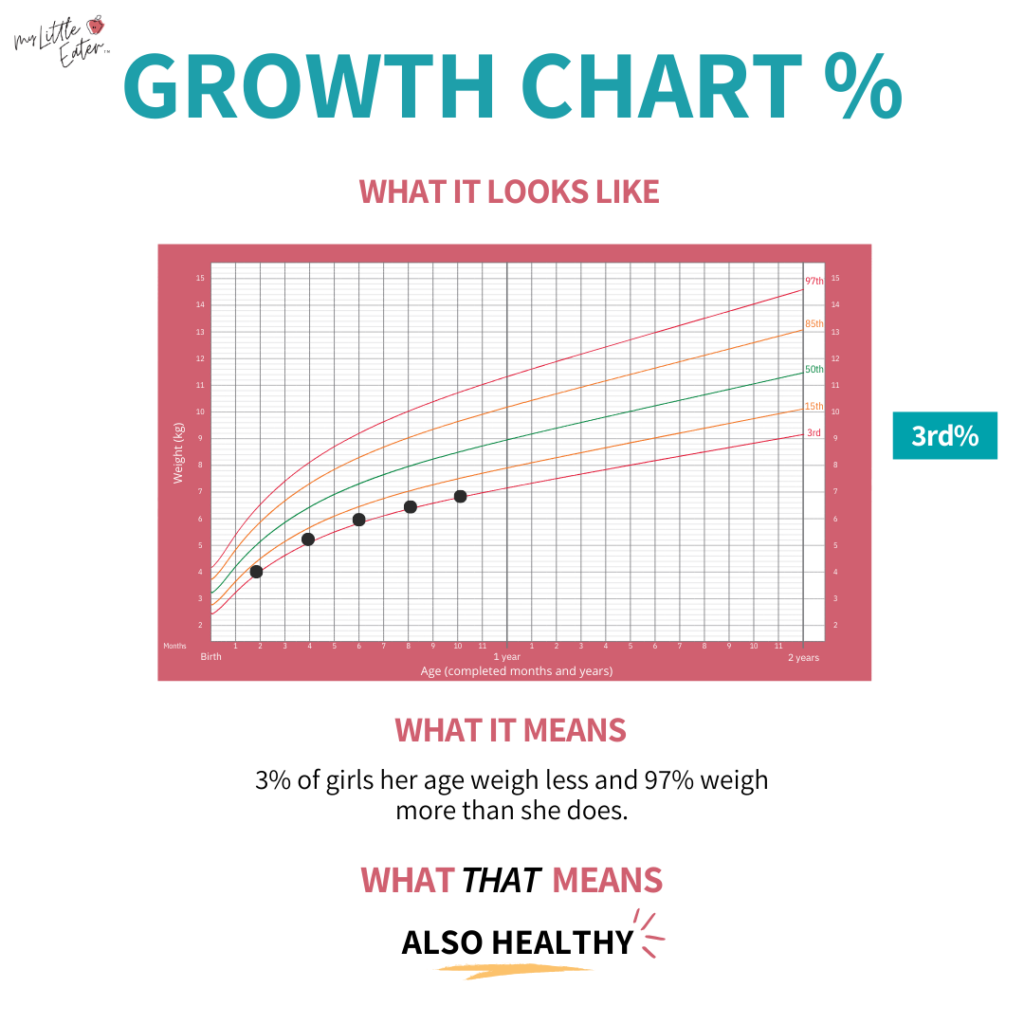
A common misconception is that these percentiles represent a grading system where a higher number is "better." In clinical practice, a child at the 15th percentile is statistically just as healthy as a child at the 85th, provided they are following their own consistent curve. The percentile indicates where a child sits in relation to the reference population: the 50th percentile, for instance, represents the median, where half the reference group is larger and half is smaller. The critical diagnostic value is not the specific percentile at a single point in time, but the stability of that trend over several months.

Standards of Reference: WHO vs. CDC
The medical community relies on two primary standards for growth assessment: the World Health Organization (WHO) standards and the Centers for Disease Control and Prevention (CDC) charts. In many regions, including Canada and for infants under two years of age in the United States, the WHO standards are the preferred metric.

The WHO charts were developed from the Multicentre Growth Reference Study (1997–2003), which tracked 8,500 children from six diverse countries: Brazil, Ghana, India, Norway, Oman, and the United States. These standards are significant because they describe how children should grow under optimal environmental and nutritional conditions, including exclusive breastfeeding for the first four to six months.
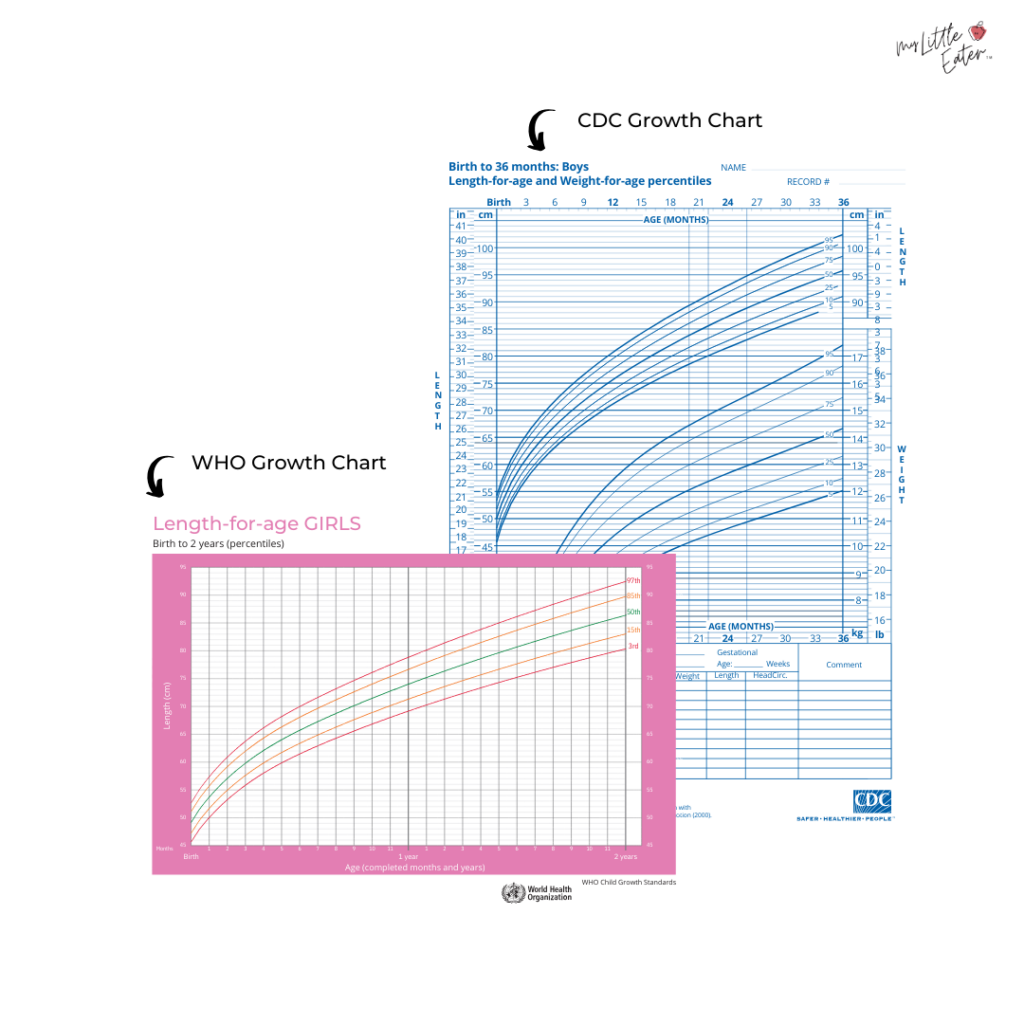
Conversely, the CDC charts—historically used in the U.S. for children over age two—are based on observational data collected from American children between 1963 and 1980. These represent how children did grow in a specific environment, rather than an ideal standard. Because the WHO standards reflect global growth potential in optimal conditions, they are widely considered the gold standard for assessing infants and toddlers, regardless of whether they are breastfed, formula-fed, or receiving a combination of both.

Clinical Interpretation of Growth Data
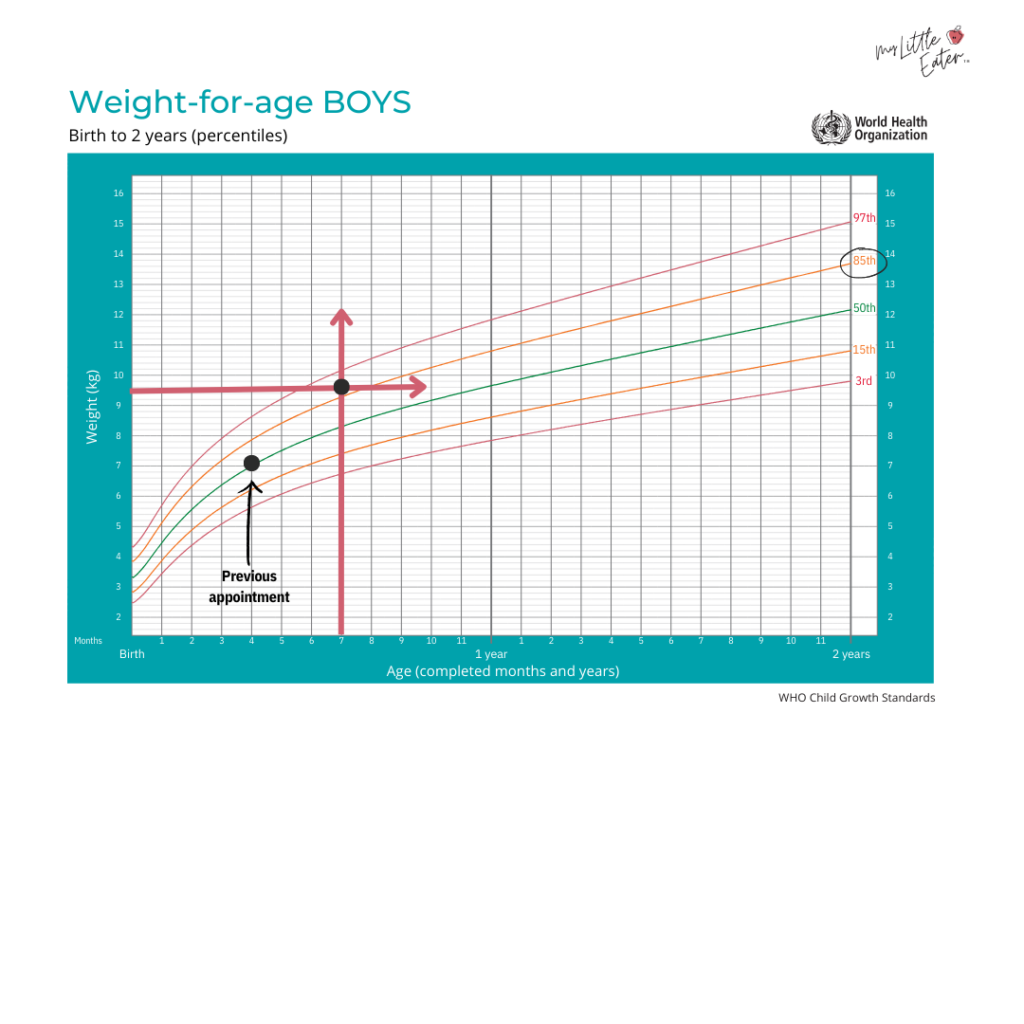
When evaluating a child’s growth, pediatricians look for "tracking"—the phenomenon where a child maintains a consistent percentile path over time. While minor fluctuations are common, sharp deviations—such as a child dropping across two or more major percentile lines—often trigger a clinical investigation.
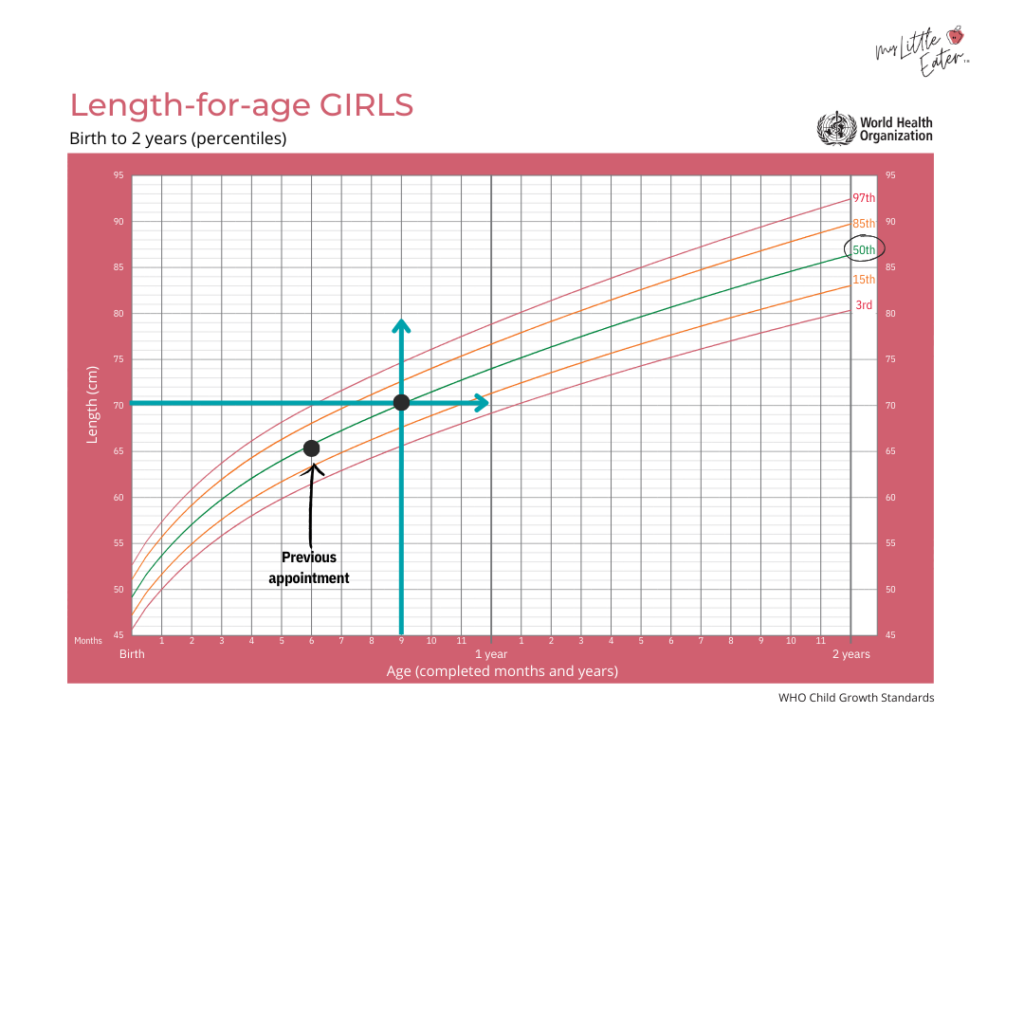
Historically, the "two-percentile rule" was used as a shorthand to identify potential growth failure, but this metric is primarily applicable to CDC-style charts with evenly spaced intervals. Because WHO charts have larger, non-uniform gaps between percentiles, clinicians now emphasize assessing the overall trajectory and potential underlying causes for any abrupt shift. A sudden "flattening" of a growth curve or a sharp decline in weight-for-age is a more reliable indicator of a potential health issue than simply falling below the 50th percentile.
Factors Influencing Infant Growth Trajectories
A child’s growth is a complex interplay of genetic, environmental, and nutritional factors. Pediatricians typically consider these variables before raising concerns about a child’s position on a growth chart:
- Genetics: A child’s biological predisposition is a significant driver of height and weight. Parents who are tall or have smaller builds are likely to have children who follow similar growth patterns.
- Nutrition: Caloric intake is the most immediate factor influencing weight gain. Issues such as iron deficiency or imbalances in caloric density can affect growth. However, experts warn against the premature introduction of solid foods as a "remedy" for low weight, as this can displace nutrient-dense breast milk or formula.
- Feeding Method: Research indicates that growth velocity differs between breastfed and formula-fed infants. Breastfed infants often show more rapid weight gain in the first six months, while formula-fed infants may gain weight more steadily in the latter half of the first year.
- Health Status: Chronic or recurrent illnesses, including infections or gastrointestinal issues like celiac disease, can inhibit nutrient absorption and lead to slower growth.
- Growth Spurts: Infants frequently experience periods of rapid growth, often occurring around 2–3 weeks, 6 weeks, 3 months, and 6 months of age. During these windows, a child may appear to deviate from their usual curve, increasing their intake and physical dimensions temporarily.
The Role of Precision Metrics: Z-Scores
For children who fall at the extreme ends of the growth spectrum—either significantly below the 3rd percentile or above the 97th—doctors may utilize Z-scores. A Z-score quantifies how many standard deviations a child’s measurement is from the mean. A Z-score of 0 is perfectly average, while positive or negative numbers indicate how far the child deviates from that norm. This provides a more granular level of precision for clinical assessment than traditional percentiles, allowing for more tailored medical interventions if necessary.

Implications of Premature Birth
Premature infants, defined as those born before 37 weeks of gestation, require specialized growth monitoring. While in the Neonatal Intensive Care Unit (NICU), infants are tracked using preterm-specific charts, such as the Fenton growth chart. Once discharged, these infants are often transitioned to WHO charts, but with a critical adjustment: clinicians must use the child’s "corrected age" (the age they would be if born on their original due date) to plot their development accurately. This adjustment usually continues until the child is approximately two years old, at which point their growth can typically be compared to standard chronological age charts.

Broader Public Health Context
The transition toward globalized growth standards, such as those promoted by the WHO, reflects a broader public health goal to standardize care. As of 2011, over 125 countries had adopted the WHO standards. This international alignment is particularly important as populations become more diverse; the WHO study confirmed that children from different ethnic and racial backgrounds exhibit similar growth potential when provided with adequate healthcare, nutrition, and a smoke-free environment.
In the United States, the continued use of CDC charts for older children serves as a point of ongoing debate among pediatricians. While the CDC charts are being updated to better reflect contemporary demographics and the modern obesity epidemic, the reliance on the WHO standards for infants remains the consensus recommendation.
Summary for Parents and Caregivers
The primary takeaway for parents is that a growth chart is a communication tool between the family and the pediatrician. It is designed to capture a longitudinal story of health, not a snapshot of perfection. If a physician expresses concern, they are looking at the entire context of the child’s life—developmental milestones, feeding history, and overall well-being.

Parents should feel empowered to ask questions during check-ups. Understanding the distinction between "normal variation" and "clinically significant change" can reduce the stress often associated with the first year of parenting. Ultimately, if a child is meeting developmental milestones and following a consistent trajectory—even if that trajectory is at the lower or higher end of the curve—the growth chart is likely confirming that the child is developing according to their own unique genetic and environmental blueprint. For any genuine concern, a pediatric dietitian or a medical professional remains the best resource for interpreting these data points and developing a personalized, supportive plan for the child’s health.
Related posts: